
Interaction to Next Paint: How to Find and Fix Slow Interactions
Vincent
15/01/2026
41
Interaction to Next Paint measures how long users wait after a click, tap, or key press before the page shows a visual response. In 2026, INP should be reviewed through field data, mobile journeys, DevTools traces, JavaScript work, and conversion paths where delayed feedback can make a page feel broken.
What Interaction to Next Paint means and when it matters
Interaction to Next Paint is a Core Web Vitals metric that measures page responsiveness across user interactions. It matters when a user taps a menu, submits a form, opens a filter, or clicks a CTA, then waits too long before the page visibly responds.
INP observes interaction latency during a page visit and reports the longest meaningful interaction after ignoring outliers. A good INP score is 200 milliseconds or less, while values above 500 milliseconds are poor. The threshold should be evaluated at the 75th percentile of page loads, segmented by mobile and desktop.
For SEO teams, the value is practical. INP turns a vague complaint like “the page feels laggy” into a measurable interaction issue. That makes it easier to brief developers and prioritize affected templates.
| Slow interaction | What users feel | Business risk |
| Mobile menu tap | Navigation feels delayed | Lower page depth |
| Product filter | Results feel stuck | Lower shopping intent |
| Form submit | Lead action feels uncertain | Fewer submissions |
| Add-to-cart click | Purchase path feels broken | Revenue friction |
| FAQ accordion | Content feels unresponsive | Lower engagement |
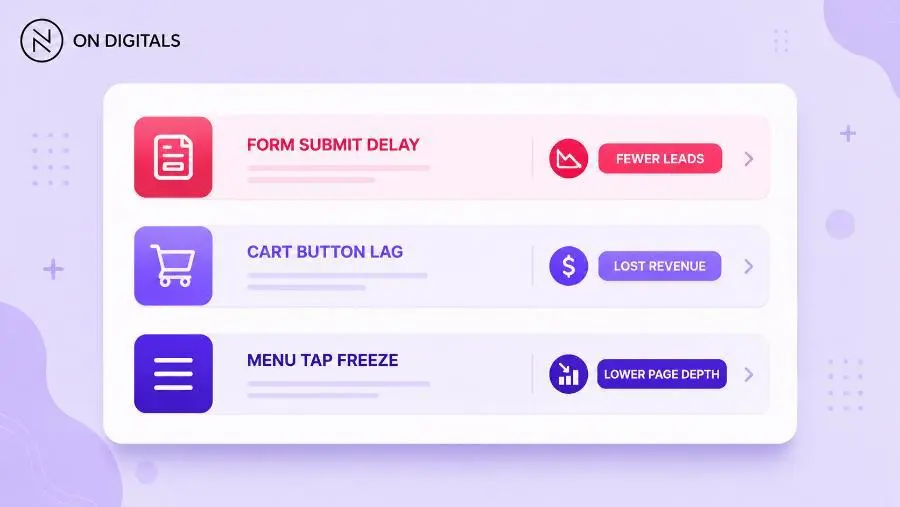 If a user clicks an “Add to Cart” button or submits a lead form and the page freezes, purchase intent plummets due to lost trust.
INP matters most on interactive pages. Static articles may have fewer risks, while ecommerce pages, service forms, dashboards, booking flows, and single-page applications can expose responsiveness issues quickly.
Why Interaction to Next Paint affects rankings, user experience, and conversions
Interaction to Next Paint affects SEO because it is now part of Core Web Vitals. It affects user experience because delayed visual feedback makes users doubt whether the page registered their action. It affects conversion when forms, filters, or purchase controls feel slow at the moment of intent.
INP officially became a Core Web Vital and replaced First Input Delay in March 2024. That change matters because FID only looked at the first interaction, while INP evaluates responsiveness across the page visit.
For On Digitals, INP should be treated as a user confidence metric. A page may load quickly, yet still feel poor when a tap triggers a delayed response. This is common on JavaScript-heavy mobile pages where the main thread stays busy after visible content appears.
| Page type | INP risk | What to protect |
| Lead page | Form delay | Submission confidence |
| Ecommerce page | Filter or cart delay | Purchase intent |
| Landing page | CTA delay | Campaign efficiency |
| Dashboard | Control delay | Task completion |
| Blog page | Accordion or search delay | Content discovery |
This is also where AEO and AI search context matters. Search systems can summarize a page, but users still judge the live website when they click through. If the page feels slow after interaction, visibility does not translate into trust.
How Interaction to Next Paint is scored in field data
Interaction to Next Paint should be interpreted from field data when possible. Field data reflects real users across different devices and network conditions, while lab tools help diagnose the cause behind a slow interaction.
Web.dev defines the main thresholds clearly: 200 milliseconds or less is good, above 200 to 500 milliseconds needs improvement, and above 500 milliseconds is poor. These thresholds should be measured at the 75th percentile for mobile and desktop separately.
| INP range | Meaning | SEO team action |
| 200 ms or less | Good responsiveness | Monitor during releases |
| Above 200 ms to 500 ms | Needs improvement | Review interaction patterns |
| Above 500 ms | Poor responsiveness | Prioritize technical fixes |
A page can have a strong LCP and still fail INP. That means the page appears fast, while user actions feel delayed. This is why performance work should not stop after loading metrics.
A strong INP review asks two questions. Which interaction is slow? Which technical task delays the next paint? From there, the team can diagnose the actual code path instead of applying generic speed recommendations.
How to debug INP in Chrome DevTools
Chrome DevTools helps teams reproduce slow interactions and inspect what happens between the user action and the next visual update. This is important because INP problems often hide behind real interactions that a generic page-load test may miss.
The Chrome DevTools Performance panel can record CPU profiles and reveal performance bottlenecks. It can also capture local INP after you interact with a page, giving teams a way to inspect responsiveness using their own device and connection.
A practical debugging flow looks like this:
| Step | What to do | Why it matters |
| Open DevTools | Go to the Performance panel | Prepare a trace |
| Start recording | Capture the interaction | See real timing |
| Perform the action | Tap the target element | Reproduce the issue |
| Stop recording | Review the trace | Find the delay source |
| Inspect interaction | Check input delay and processing | Separate causes |
| Validate fix | Record again after changes | Confirm improvement |
Chrome’s Performance features reference shows that the Interactions track can display INP warnings for interactions longer than 200 milliseconds. It also lets teams inspect input delay, processing time, and presentation delay.
This workflow gives developers a clear starting point. Instead of saying “INP is bad,” the SEO team can point to a recorded interaction and show where the delay happens.
Identify the element that caused poor INP
Fixing INP starts with identifying the interaction target. The slowest interaction may come from a menu, form button, product filter, tab switcher, search field, or custom widget. Once the element is known, developers can trace the handler and related rendering work.
This is where field data and DevTools should work together. Field data can show that product pages have poor INP. DevTools can help reproduce a likely interaction, such as switching variants or applying filters.
| Interaction target | Possible cause | Better fix direction |
| Mobile menu | Heavy script on open | Reduce handler work |
| Product filter | Large DOM update | Batch UI updates |
| Form button | Validation blocks thread | Split validation work |
| Search input | Query runs too often | Debounce input |
| Cart button | Third-party scripts fire | Audit tag behavior |
| Accordion | Layout recalculation | Simplify DOM updates |
Many INP problems come from JavaScript work that blocks the main thread. Other cases come from rendering pressure after the event handler finishes. The fix depends on which part of the interaction timeline creates the delay.
A useful ticket should state the target element, the user action, the delay type, and the expected response. This gives developers enough context to reproduce the issue.
How to optimize Interaction to Next Paint by delay source
Optimizing Interaction to Next Paint means reducing the time between user input and visual feedback. The work usually falls into three areas: input delay, processing duration, and presentation delay.
Web.dev’s INP optimization guidance recommends reducing long tasks, limiting main-thread work, and improving how quickly the browser can present the next frame after interaction.
| INP delay source | What it means | Better fix |
| Input delay | Browser is busy before handling input | Break up long tasks |
| Processing duration | Event handler takes too long | Reduce JavaScript work |
| Presentation delay | Visual update takes too long | Simplify rendering |
| Third-party pressure | External scripts block work | Defer or remove tags |
| Layout work | DOM update is expensive | Batch reads and writes |
| Heavy framework render | UI updates too much | Reduce rerenders |
For mobile pages, JavaScript is often the main source of INP issues. A page may load fine, then struggle once users interact with menus, filters, sliders, or forms.
The right fix is usually smaller work chunks and faster feedback. Show the user that the page heard the action, then finish heavier work after the next paint when possible.
Step-by-step implementation framework for marketers and SEO teams
An INP workflow should start with real-user data, then move into interaction-level diagnosis. This keeps the work tied to user frustration instead of turning the audit into a generic JavaScript cleanup task.
Use this framework:
- Choose priority templates
Start with pages tied to leads, sales, paid traffic etc. - Check field data first
Use PageSpeed Insights or Search Console Core Web Vitals to confirm whether real users experience weak INP. - Find the likely interaction
Review the page journey. Look for menus, forms, filters, cart actions, accordions etc. - Record the interaction in DevTools
Use the Performance panel to capture the slow action. - Separate the delay source
Check whether the issue comes from input delay, processing time, or presentation delay. - Assign the right owner
Frontend code, tracking tags, framework rendering, or third-party scripts may need different teams. - Fix one template first
Validate the change on a representative URL before expanding. - Monitor field data after release
Lab improvement can appear quickly. Field data needs real visits before the trend moves.
This workflow helps SEO teams brief developers with evidence. It also helps stakeholders see why a slow interaction can hurt conversion even when the page loads quickly.
Common mistakes, risks, and quality checks
Most INP mistakes happen when teams focus only on page load. A page can appear fast and still feel slow after a tap. That makes INP different from metrics like LCP, which focus on the first visible content moment.
Use this QA table before assigning work:
| Mistake | Risk | Better action |
| Testing only load speed | Slow taps remain hidden | Record real interactions |
| Checking desktop first | Mobile lag gets missed | Start with mobile field data |
| Removing scripts blindly | Tracking breaks | Audit tag value first |
| Fixing only one URL | Shared template remains slow | Test a URL group |
| Ignoring third-party handlers | Main thread stays blocked | Review tag behavior |
| Treating TBT as INP | Lab proxy misleads | Confirm with field data |
A strong INP ticket should answer one question: which user action feels delayed, and what work blocks the next paint?
If the ticket cannot answer that, the team needs a better trace before development starts.
Tools and metrics to review before publishing
INP review works best with a focused tool stack. PageSpeed Insights gives field and lab context. Search Console shows affected URL groups. Chrome DevTools helps developers record the specific interaction.
| Tool | Role | Best use |
| PageSpeed Insights | Field and lab view | URL review |
| Search Console CWV report | URL group monitoring | Template priority |
| Chrome DevTools | Interaction trace | Developer debugging |
| Lighthouse | Lab performance context | Pre-release QA |
| RUM platform | Interaction-level data | Production monitoring |
Before publishing a major template update, review key interactions instead of only running a page-load test. Tap the mobile menu. Submit a form. Apply a product filter. Trigger any component that matters to the user path.
Useful INP QA areas include:
- Mobile INP field data.
- Slow interaction target.
- Input delay.
- Processing duration.
- Presentation delay.
- Long tasks.
- Third-party script pressure.
- Main-thread blocking time.
This keeps INP work tied to real user actions. The score matters, while the delayed interaction matters more.
FAQ about Interaction to Next Paint
What is Interaction to Next Paint?
Interaction to Next Paint is a Core Web Vitals metric that measures how long a page takes to show a visual response after a user interaction. It observes click, tap, and keyboard interactions across the page visit, then reports the longest meaningful interaction.
What is a good INP score?
A good INP score is 200 milliseconds or less. Scores above 200 milliseconds and up to 500 milliseconds need improvement. Scores above 500 milliseconds are poor. The threshold should be evaluated at the 75th percentile of page loads across mobile and desktop.
How is INP different from FID?
FID measured the delay before the browser could start processing the first interaction. INP measures the broader interaction experience by observing interactions across the page visit and waiting until the next paint. INP replaced FID as a Core Web Vital in March 2024.
What causes poor Interaction to Next Paint?
Poor INP often comes from long JavaScript tasks, heavy event handlers, expensive rendering, third-party scripts, or framework updates that block the main thread. The right fix depends on the interaction target and which part of the timeline creates the delay.
How do I improve INP on mobile?
Start with mobile field data, then reproduce the slow interaction in Chrome DevTools. Break up long tasks, reduce event handler work, simplify UI updates, and defer low-priority scripts. Validate the fix on several URLs from the same template before closing the task.
Does Interaction to Next Paint affect SEO?
INP is part of Core Web Vitals, which contributes to Google’s page experience evaluation. Better INP can support a smoother user experience, especially on mobile. Ranking still depends on search intent, content quality, authority, and other systems.
Conclusion: use INP to protect the moment after users act
Interaction to Next Paint helps teams understand whether a page responds when users expect feedback. A useful workflow starts with field data, identifies the slow interaction, then traces the delay in DevTools before assigning fixes.
For businesses, improving INP protects moments where users show intent. A menu tap, form submit, filter click, or cart action should feel immediate enough to keep trust. If your team needs to diagnose poor INP across key templates, On Digitals can help turn responsiveness data into a practical roadmap for smoother mobile UX and stronger conversion paths.

NEWEST POSTS
- Advertising Industry In Vietnam: The 2026 Trends, Channels and Market-Entry Strategy
- Best SEO Company in Vietnam: Latest Shortlist For Businesses
- How To Leverage Social Media For Customer Service Like A Pro?
- Social Media Post Tips – 8 Ways To Boost Engagement
- How To Use Social Media for Sales – In-depth Beginner Guide
Read more