
Insights
PageSpeed Insights – All Things SEOer Need To Know!
On Digitals
19/01/2026
25
PageSpeed Insights helps you understand how fast your website really loads and where it may be slowing down. Slow-loading pages frustrate visitors, reduce engagement, and can even hurt your search rankings.
Let’s dive into how it works, what metrics matter, and how you can improve your score without needing a developer!
An introduction to PageSpeed Insights for beginners
This leads many beginners to ask: what is PageSpeed Insights, and how does it actually evaluate website performance? It is a free online tool that evaluates how your webpages perform on both mobile and desktop devices. It also provides key metrics, called Core Web Vitals, which measure the quality of the user experience. The tool generates a score from 0 to 100, with higher scores indicating that your page is better optimized for speed and efficiency.
PSI relies on Lighthouse, an open-source automated tool, to analyze page performance and quality. It produces a detailed report with recommendations for improvements, based on two types of data:
- Lab data: Collected in a controlled environment by Lighthouse, lab data helps identify and troubleshoot performance issues. However, it may not reflect the actual experience of real users.
- Field data: This comes from real-world user interactions with your site. It provides a more accurate picture of user experience but includes fewer metrics than lab data. This difference often raises the question: “Is Google PageSpeed Insights accurate when evaluating real user experience?”
A beginner-friendly overview of website performance testing fundamentals
What makes a PageSpeed Insights score ‘good’?
According to Google, a Google PageSpeed Insights score of 90 or higher is considered excellent. Scores between 50 and 89 indicate the page could be improved, while anything below 50 is regarded as poor. These numbers give a general idea of how well your pages perform in terms of speed.
If your pages consistently score below 90, visitors might experience slower load times or frustration. Poor performance can also affect your SEO rankings over time. However, a lower score doesn’t always mean your site is failing – context matters.
Chasing a perfect 100 on every page isn’t necessary. What really matters is that users can access the information or solutions they need quickly. A strong user experience outweighs a perfect numeric score.
Understanding score ranges and what they mean for performance
The SEO impact of your PageSpeed Insights results
A fast-loading website improves both user experience and search engine performance. Optimizing your pages can lead to higher engagement and better rankings.
Pagespeed is not a direct ranking factor
Google doesn’t directly rank your site based on your PSI score. The score itself is just an indicator of performance. However, it reflects page speed, which is a confirmed ranking factor.
Faster pages lower user frustration
Slow-loading pages often frustrate visitors and cause them to leave. On the other hand, quick-loading pages encourage users to stay longer. Better engagement can indirectly benefit SEO.
User experience drives SEO rewards
A smooth, responsive site leads to a better overall experience for users. Search engines favor sites that keep visitors happy. Providing a great page experience can positively influence rankings. This clearly shows why PageSpeed Insights SEO optimization matters for long-term visibility.
How website speed influences rankings and user engagement
Guide to testing your site with PageSpeed Insights
Google PageSpeed Insights is a free and very user-friendly tool that allows you to check exactly how fast your webpages load, whether on desktop or mobile devices. It provides actionable insights and recommendations to improve both speed and user experience. By following its guidance, you can make your website faster, more stable, and better optimized for SEO.
Entering your URL and running the analysis
To get started, simply go to the main website and enter any URL, whether it’s your own site or a competitor’s, and then click the “Analyze” button. The tool will process the page, which can take anywhere from a few seconds to over a minute depending on page complexity and internet speed. This shows how the Google PageSpeed Insights tool evaluates performance and identifies potential issues. This first step gives you an overview of how your page is performing and highlights areas that might need attention.
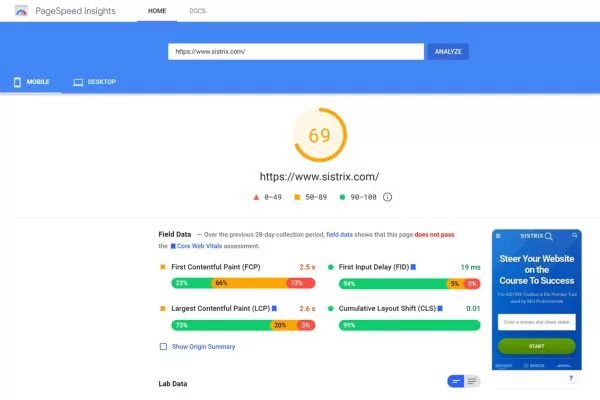
Viewing the mobile and desktop reports
Once the analysis is complete, you can view separate reports for both mobile and desktop versions of your page to understand performance across devices. At the top of each report, you’ll see the Core Web Vitals Assessment, which shows whether your page meets Google’s standards for speed, responsiveness, and stability. These metrics provide a quick snapshot of how users experience your page in real-world scenarios. This step helps beginners understand PageSpeed Insights how to use across different devices.
Key metrics in tool
PSI tracks several important metrics to assess page performance:
- Largest Contentful Paint (LCP): Time for the largest content element to appear.
- Interaction to Next Paint (INP): How quickly the page responds to user actions.
- Cumulative Layout Shift (CLS): Measures unexpected layout shifts during load.
- First Contentful Paint (FCP): Time for the first visible content to load.
- First Input Delay (FID): Measures responsiveness to the first user interaction (replaced by INP in 2024).
- Time to First Byte (TTFB): How fast the server responds with the first byte of data.
Making sense of your performance results
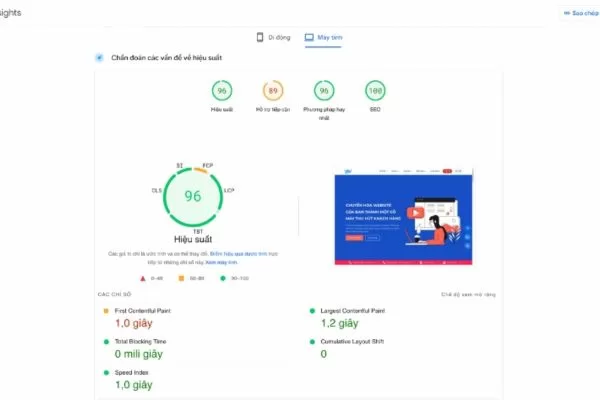
PSI assigns scores in four categories:
- Performance: Reflects speed and optimization based on metrics like FCP, LCP, INP, CLS, and TBT.
- Accessibility: Evaluates ease of navigation, alt text for images, and color contrast for all users.
- Best Practices: Checks adherence to modern web standards, secure connections, and optimized code.
- SEO: Measures search engine optimization factors such as metadata, structured data, and mobile-friendliness.
These scores help you identify strengths and areas for improvement.
Analysis findings and optimization tips
The diagnostics section lists issues your page didn’t pass and provides improvement suggestions. The PageSpeed Insights tool prioritizes these issues based on their potential performance impact.
- Optimizing images
- Simplifying code
- Reducing server response times
You can click each item to see detailed explanations and how to fix them.
Rerunning the analysis
After making the suggested improvements, it’s important to rerun the analysis to see how much your page performance has improved. Running tests at different times of day can provide slightly different results due to network conditions or server load. Regularly monitoring your pages in this way ensures your website stays fast, responsive, and optimized for both users and search engines.
A step-by-step walkthrough for evaluating website speed
Simple strategies to improve your google PSI score
Improving your PageSpeed Insights (PSI) score begins by following recommendations from your PSI and Site Performance reports. Simple fixes like resizing images can be done yourself, while others, such as reducing unused JavaScript, may need a developer. Here’s a step-by-step guide to applying Google’s common PSI suggestions to boost your score:
Fixing render-blocking issues on your page
Render-blocking resources like CSS, JavaScript, and fonts can delay page rendering because the browser must load them before displaying content. Removing or deferring these files can help your pages load faster and improve your PSI score.
To address this, check the “Diagnostics” section in your PSI report for the Eliminate render-blocking resources suggestion. Click the arrow to see which files are causing delays and the potential time savings in milliseconds.
Once you’ve identified the unnecessary or non-critical resources, decide whether they can be removed, inlined, or deferred. If you’re not familiar with coding, you may need a developer’s help to safely make these changes.
Decreasing first-byte response time
The server response time, or Time to First Byte (TTFB), measures how long it takes for the browser to receive the first byte of data from your server. A slow TTFB can delay page rendering and negatively affect overall load speed, frustrating users.
When someone visits your website, their browser sends a request to the server, which then processes it and returns the page content. Google PageSpeed Insights flags a recommendation to “Reduce initial server response time” if the server takes longer than 600 milliseconds to respond.
To improve server response times, consider the following strategies:
- Choose a hosting provider with fast, low-latency servers.
- Optimize server-side code and remove unnecessary processes to generate pages faster.
- Properly index database tables and, if necessary, upgrade to a higher-performance database.
- Enhance server hardware by adding more RAM or faster processors to handle requests efficiently.
- Use a Content Delivery Network (CDN) to distribute resources across multiple servers, reducing delivery time.
- Most of these improvements will likely require developer support or coordination with your web host to implement safely and effectively.
Most of these improvements will likely require developer support or coordination with your web host to implement safely and effectively.
Improving image efficiency for faster loading
Large or unoptimized images can significantly slow down your page load speed and affect the user experience. Google PageSpeed Insights identifies images that aren’t properly sized, showing their current size and potential savings in kilobytes. By resizing and compressing these images, you can save bandwidth and improve overall load times.
There are several ways to optimize your images, and most are relatively simple to implement:
- Use tools like TinyPNG or ShortPixel to compress images before upload.
- Choose the best file format (JPEG, PNG, GIF, WebP) to balance quality and size.
- Use the “srcset” attribute to serve the correct image size depending on the user’s device.
- Implement lazy-loading with WordPress plugins like LazyLoad or Smush.
For WordPress users, optimizing images can be done easily with TinyPNG. After installing and activating the plugin, register an account, go to the Media Library, and select Bulk Optimization. The plugin will display the number of images optimized and the total space saved, making it simple to track improvements.
Enhancing site performance through smarter image handling
Fixing delays caused by chained resources
Chaining critical requests happens when a page must download multiple files and assets in sequence before displaying content. For example, text might not appear until certain images load, which themselves depend on a CSS file, creating a chain of dependencies. If any of these resources fails to load, the browser can’t render the page, causing noticeable delays.
To fix this, you need to set priorities for resources so that critical assets load first and non-essential files load afterward. Adding “async” and “defer” attributes to your scripts is a common solution recommended by PageSpeed Insights. Async lets the browser continue rendering the page while the script loads in the background, and defer delays the script until after the page is visible.
If you’re not comfortable editing website code, a developer can implement these changes for you. Be aware that using async and defer may cause issues with certain scripts. Always test thoroughly to ensure your page works correctly after making these adjustments.
Optimizing key requests to improve PSI scores
Preloading key requests tells the browser to prioritize critical assets and download them first, allowing the most important files to load faster. According to PageSpeed Insights, this can improve your page load times and overall performance.
Key requests are any resources the page needs during the early loading stage. The most common examples are fonts, but this can also include JavaScript, CSS, and images that are essential for rendering content quickly.
For WordPress sites, you can use plugins like Preload Image or Pre Party to implement preloading easily. Otherwise, a developer can identify critical requests and add preload tags to your website code. Properly preloading key resources is a recommendation highlighted in the tool for faster, smoother page loading.
Minifying CSS and JavaScript
CSS is essential for styling your website, but oversized CSS files can slow down page load times. Similarly, JavaScript is critical for functionality but can significantly impact speed if not optimized. According to PageSpeed Insights, reducing the size of your code through minification helps your site load faster and improves performance scores.
Minifying involves removing unnecessary characters from CSS and JavaScript files, such as white spaces, comments, and unused code. There are many tools available for this, including Toptal CSS Minifier, Toptal JavaScript Minifier, and Minify. You can also use lightweight JavaScript frameworks like jQuery or React for faster loading.
For WordPress users, plugins can simplify the process. Popular options include Hummingbird, LiteSpeed Cache, and W3 Total Cache. With Hummingbird, install and activate the plugin, complete the setup wizard, and ensure your files are marked “Active” in the Gzip Compression section. Properly minified CSS and JavaScript are key recommendations highlighted by PageSpeed Insights to boost page speed.
Defer non-visible images to boost page performance
Page speed can be slowed when the browser loads images that aren’t immediately visible to the user. PageSpeed Insights identifies these offscreen assets and estimates potential time savings if they are deferred. Prioritizing the display of visible elements first allows the page to render more quickly for visitors.
This can be achieved through lazy loading, which delays the download of images until they appear on the screen. For instance, pictures only fetch as the user scrolls down the page. This approach can greatly shorten load times, especially on mobile networks or slower connections.
WordPress users can implement this easily with plugins like Lazy Loader. Deferring non-essential visuals is a best practice highlighted by this tool to enhance both performance and the user experience.
Decrease HTML complexity
The DOM shows your webpage structure in a tree-based layout. Pages with excessively large DOMs can experience slower rendering and provide a subpar user experience. PageSpeed Insights flags overly complex DOMs and provides guidance for reducing unnecessary elements.
To shrink your DOM, work with your developer to remove redundant HTML element and attributes, as well as unused JavaScript or CSS files. You can also implement server-side rendering (SSR) to pre-render pages before sending them to the browser. Avoid relying heavily on visual page builders, which often produce bloated HTML, and prefer clean-coded themes and plugins.
Tools like Google Chrome DevTools can help analyze your DOM structure and pinpoint areas for optimization. Simplifying the DOM often requires technical expertise, so developer support may be necessary. Following these practices aligns with PageSpeed Insights recommendations for faster page loading and improved user experience.
Simplifying URL redirects
Redirects automatically send visitors from one URL to another, but too many redirects can slow down your site. Each extra redirect adds a step, increasing the time it takes for a page to load. PageSpeed Insights flags multiple consecutive redirects as a factor that can negatively affect page speed.
Redirect chains occur when old URLs point to intermediate pages before reaching the final destination. These often happen as websites update or remove pages, creating a series of redirects between the original and current URLs. While Google can follow up to 10 redirects, chains unnecessarily delay loading and should be simplified to improve your PSI score.
You can identify chains using an SEO tool like Site Audit. In the tool, go to the Issues tab, search for “redirect,” and click on “# redirect chains and loops” to see a list of affected pages and their redirect types. Once identified, remove unnecessary redirects and ensure traffic is sent directly from the original page to the final URL.
For WordPress sites, plugins like Easy Redirect Manager, Redirection, or Simple Page Redirect make managing redirects easier. With Easy Redirect Manager, install and activate the plugin, then use Manage Redirects to set new rules by entering the old URL and the target page, and click Save. Properly streamlining redirects is a key recommendation in this tool for faster page loading and a better user experience.
Eliminating unused third-party scripts
Third-party code includes scripts, pixels, and plugins added from external sources, and it can slow down your website while lowering your page speed score. Some third-party code is essential, such as Google Analytics for tracking performance or Facebook Pixel for ad campaigns. However, unused or redundant scripts can unnecessarily block the main thread and delay page loading.
Regularly auditing external scripts helps identify unnecessary third-party code. In your PageSpeed Insights report, Google highlights these scripts along with their transfer size and main-thread blocking time. Pay attention to the company names listed in gray bars, which show the source of each script and its category, such as Tag Manager, Social, Utility, or Analytics.
Remove any scripts or tools that are no longer needed. This may involve deleting code from your CMS, uninstalling unused plugins on WordPress, or removing tags from a tag management system. Properly managing third-party code is a key recommendation from this tool to improve page speed and provide a better user experience.
Practical actions to enhance website speed and stability
Essential FAQs for PageSpeed Insights
PageSpeed Insights helps website owners understand how fast their pages load and how users experience them. Below are some of the most common questions to help you better understand the tool, its scores, and its SEO impact.
What exactly is Google PageSpeed Insights?
It is a free tool from Google that analyzes the performance of a web page on both mobile and desktop devices. It provides a performance score, Core Web Vitals data, and actionable recommendations to improve speed and user experience.
Does PageSpeed Insights influence search engine rankings?
Google does not use the PageSpeed Insights score directly as a ranking factor. However, the metrics behind the score – such as Core Web Vitals – do influence rankings, making performance optimization important for SEO.
What is an ideal score in PageSpeed Insights?
A score between 90 and 100 is considered good and indicates strong performance. That said, focusing on real-world metrics like LCP, INP, and CLS is more important than aiming for a perfect score.
Why are mobile and desktop performance scores not the same?
This tool tests mobile and desktop using different device and network simulations. Mobile scores are often lower because they account for slower networks and less powerful hardware.
How often do you need to run PageSpeed Insights?
You should run this tool after major site updates, design changes, or technical improvements. Regular monthly checks also help catch performance issues early and maintain a fast website.

Clear answers to common performance and speed questions
Conclusion
PageSpeed Insights is a powerful tool for evaluating website speed and overall performance, helping site owners understand how efficiently their pages load and interact with users.
By improving loading speed, responsiveness, and visual stability, websites can deliver a smoother user experience while supporting stronger SEO results. With the right strategy and technical support from On Digitals, these performance insights can be transformed into practical optimizations that drive sustainable growth.
Read more