
PageSpeed Insights Guide for SEO, UX, and Conversion Decisions
Vincent
19/01/2026
25
PageSpeed Insights guide content should help SEO teams read real-user speed data, lab diagnostics, and Core Web Vitals in one workflow. In 2026, the key focus is INP, mobile UX, CrUX field data, and conversion impact. For broader implementation, connect PSI findings with a technical SEO workflow instead of treating page speed as a standalone score.
What PageSpeed Insights means and when it matters
PageSpeed Insights is a Google tool that reports how a web page performs on mobile and desktop. It combines field data from Chrome UX Report with Lighthouse lab diagnostics, then gives recommendations for improving page experience.
The tool matters when a team needs to understand whether performance issues affect real users. A lab score can show a technical bottleneck, while field data shows how visitors experience the page in production.
PageSpeed Insights is useful after major site updates, template changes, landing page launches, or traffic drops. It helps marketers and developers discuss performance with a shared report instead of relying on isolated test results.
| Question | PSI helps by showing |
| Are real users affected? | Field data from CrUX |
| Which metric is weak? | Core Web Vitals assessment |
| What needs debugging? | Lighthouse lab diagnostics |
| Which device needs priority? | Mobile and desktop reports |
| What should be fixed first? | Opportunities and diagnostics |
Use PSI as a decision tool. The report should guide which page, metric, and fix deserve attention first.
Why PageSpeed Insights affects SEO and conversion decisions
PageSpeed Insights affects SEO work because it makes page experience visible. A slow page can weaken user engagement, especially on mobile. For conversion teams, weak responsiveness or unstable layout can also make forms, CTAs, and product interactions harder to complete.
Google Search Console’s Core Web Vitals report uses actual user data grouped by URL status. That makes field performance important for SEO monitoring because it reflects user experience at scale rather than one lab test.
The PSI score itself should not become the business target. A page may score lower because of heavy features that support conversion. Instead, teams should inspect the underlying metric that affects users most. For pages where mobile users show weak field data, review these PageSpeed Insights mobile optimization tips before assigning fixes. Mobile PSI issues often come from slow server response, heavy scripts, oversized media etc., so each warning should map to a clear technical owner.
| Performance issue | User impact | Business risk |
| Slow LCP | Main content appears late | Higher landing page drop-off |
| Weak INP | Page reacts slowly after tap | Friction in forms or filters |
| Poor CLS | Layout shifts during load | Misclicks near CTA areas |
| High TTFB | Server response starts late | Slower first impression |
| Heavy third-party scripts | Main thread stays busy | Lower mobile responsiveness |
A good PageSpeed Insights guide should help teams connect each warning with a clear owner. Some fixes belong to developers. Others involve design, tracking setup, media handling, hosting, or content workflow.
How PageSpeed Insights reads real-user data through CrUX?
PageSpeed Insights uses Chrome UX Report data when enough real-user data is available for a page or origin. CrUX reflects how Chrome users experience pages across real devices, networks, and locations.
This is why PSI can feel different from a one-time speed test. Lab data opens the page under controlled conditions. Field data summarizes real user visits over time. If those two sections disagree, the disagreement is often the most useful part of the report.
For example, Lighthouse lab data may look good in a clean test. PSI field data may still show poor mobile INP because real users browse on weaker devices or interact with heavier page states.
| PSI data section | What it answers | Best use |
| Field data | What real users experience | SEO and UX monitoring |
| Origin data | Broader site-level performance | Sites with limited URL data |
| Lab data | What the test sees now | Debugging and QA |
| Opportunities | What could improve speed | Task planning |
| Diagnostics | Why the page behaves poorly | Technical review |
Use field data for priority decisions. Use lab data to understand what the team can fix next.
Differences between field data in PSI and CrUX
Field data in PSI comes from Chrome UX Report, but PSI is not the full CrUX ecosystem. PSI gives a focused view for a page or origin, while CrUX can also be explored through APIs, datasets, and dashboards. The PSI interface is easier for routine page checks.
The practical difference is depth. PSI helps a marketer quickly see whether a URL passes Core Web Vitals. CrUX tools can support deeper analysis when teams need origin-level trends, segmentation, or more flexible reporting.
A PSI report may show URL-level data only when the page has enough data. When the exact URL has limited data, PSI may show origin-level data instead. That shift matters because origin data can hide issues on one weak template.
| Situation | How to interpret the report |
| URL field data exists | Use it for page-level decisions |
| Only origin data appears | Treat it as site-level context |
| Field data is unavailable | Use lab data, then monitor later |
| URL and origin differ | Prioritize the exact URL when available |
| Template issue appears | Test several pages in the same group |
This is especially important for B2B and service websites. Some key pages may have limited traffic, so PSI may rely more heavily on lab diagnostics. In that case, test related templates before making a broad conclusion.
Core Web Vitals metrics in PageSpeed Insights
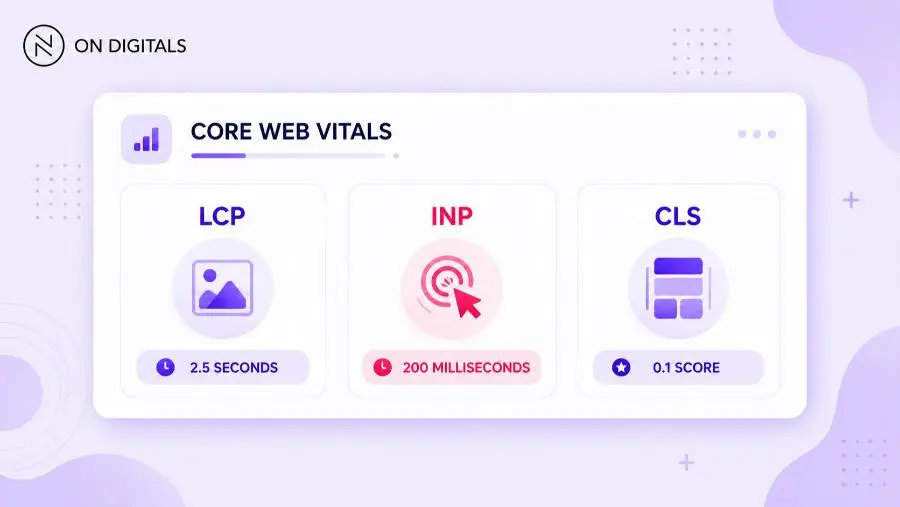
Core Web Vitals focus on the parts of performance users can feel. LCP measures when the main content appears. INP measures response after interaction. CLS measures visual stability while the page loads.
Google’s Web Vitals guidance lists good thresholds as LCP within 2.5 seconds, INP at 200 milliseconds or less, and CLS at 0.1 or less.
| Metric | What it measures | Good threshold |
| LCP | Main content loading | 2.5 seconds or less |
| INP | Interaction responsiveness | 200 milliseconds or less |
| CLS | Layout stability | 0.1 or less |
 In 2026, INP (Interaction to Next Paint) deserves special attention as modern, JavaScript-heavy sites often struggle with responsiveness.
INP deserves special attention in 2026 because many modern sites rely on JavaScript-heavy layouts. A page can load quickly but still feel slow when users tap a menu, filter a product list, or submit a form.
CLS also matters for conversion. If a layout moves while a user is about to click, the page feels unstable. This risk is common with late-loading banners, images without dimensions, ads, review widgets, or font swaps.
PageSpeed Insights helps identify which metric is weak. From there, the team should match the fix to the metric instead of applying a generic “speed optimization” checklist.
Real-user data versus the PSI performance score
The PSI performance score is a Lighthouse lab score. It helps compare technical test results, but it does not replace field data. A page can have a decent lab score while real users still experience poor Core Web Vitals.
PSI combines the real-world data of CrUX with Lighthouse diagnostics, which makes it useful for both monitoring and debugging. The two sections should be read together because each one answers a different question. When the PSI performance score and lab diagnostics do not tell the same story, compare the workflow with this PageSpeed Insights vs Lighthouse guide. PSI is stronger for real-user monitoring, while Lighthouse is better for controlled debugging and pre-release validation.
A simple interpretation works well:
| If you see this | What it usually means |
| Field data poor, lab data good | Real users face conditions the test did not reproduce |
| Field data good, lab data poor | Template has technical risk worth reviewing |
| Both sections poor | Fix should be high priority |
| No field data | Use lab findings, then monitor after traffic grows |
Avoid treating the score as a single verdict. The score can change between runs, while field trends give stronger business context. For reporting, show which metric is weak and why it matters to users.
Step-by-step PageSpeed Insights framework for SEO teams
A strong PageSpeed Insights workflow should begin with business-critical pages. From there, teams can move from field data into lab diagnostics, then assign fixes by owner. This keeps the audit practical and avoids score-chasing.
Use this workflow:
1. Choose priority URLs: Start with pages tied to leads, sales, organic traffic, or paid campaigns.
2. Run PageSpeed Insights on mobile first: Mobile issues often reveal the biggest user friction.
3. Read field data before lab score: Give more weight to real-user data when it appears.
4. Identify the weakest Core Web Vital: Match each fix to LCP, INP, or CLS.
5. Review lab diagnostics: Use Lighthouse suggestions inside PSI to find technical causes.
6. Group pages by template: A weak blog template needs a different fix from a slow service page.
7. Assign technical ownership: Hosting, frontend code, tracking tags, image handling etc. may need different owners.
8. Validate after deployment: Lab data can shift quickly, while field data needs real visits before trend movement appears.
This workflow helps SEO, development, and marketing teams make the same decision from the same report.
Common mistakes and quality checks
Most PageSpeed Insights mistakes come from reading the score without reading the metric. Teams often chase a higher number while the real issue sits in mobile INP, server response, render-blocking code, or unstable above-the-fold elements.
Use this QA table before turning PSI findings into tasks:
| Mistake | Risk | Better action |
| Chasing 100/100 | Low-impact work expands | Focus on Core Web Vitals |
| Testing only homepage | Template issues stay hidden | Test money pages |
| Ignoring mobile | Real users stay affected | Start with mobile reports |
| Reading one test only | Variance misleads the team | Compare multiple runs |
| Fixing every warning | Sprint becomes unfocused | Prioritize by user impact |
| Skipping post-launch checks | Fixes remain unproven | Monitor PSI trends |
A practical check is simple: can the team explain which user problem the fix solves? If the answer is unclear, the task needs better diagnosis.
Tools and metrics to review before publishing
PageSpeed Insights works best when paired with supporting tools. PSI shows the page-level view. Search Console shows site-level Core Web Vitals patterns. Lighthouse helps developers debug in controlled conditions.
| Tool | Role | Best use |
| PageSpeed Insights | Page-level field and lab report | SEO monitoring |
| Search Console CWV report | URL group performance | Template tracking |
| Lighthouse | Controlled audit | Developer QA |
| Chrome DevTools | Network and rendering review | Debugging |
| Analytics or CRM | Business impact | Prioritization |
Before publishing a major update, review these areas:
- LCP for the main content block.
- INP for forms, menus, filters etc.
- CLS for unstable page sections.
- TTFB for server response.
- JavaScript execution time.
- Third-party script impact.
- Mobile field trend.
This list should become a release checklist for important templates. The goal is to keep high-value pages fast enough for users and stable enough for conversion.
FAQs
Is PageSpeed Insights accurate?
PageSpeed Insights is accurate for the type of data it shows. Field data reflects real Chrome user experience through CrUX. Lab data reflects a controlled Lighthouse test. If the two sections differ, treat the gap as a clue rather than an error.
What is a good PageSpeed Insights score?
A high score is useful, but Core Web Vitals thresholds matter more for user experience. Good thresholds are LCP within 2.5 seconds, INP at 200 milliseconds or less, and CLS at 0.1 or less.
Why is my mobile PageSpeed Insights score lower?
Mobile scores are often lower because mobile users may have weaker devices, slower networks, or heavier page interactions. Start with mobile because it often exposes the most urgent user friction. Then use diagnostics to find whether the issue comes from scripts, media, server response, or layout stability.
Does PageSpeed Insights affect SEO rankings?
The PSI score itself should not be treated as the ranking factor. The underlying page experience signals matter more, especially Core Web Vitals field data. Performance also supports SEO indirectly when pages become easier to use and less frustrating for visitors.
How often should SEO teams check PageSpeed Insights?
Check PageSpeed Insights after major template changes, campaign launches, tracking updates, or performance fixes. For priority pages, monthly checks are useful. After a technical release, use lab data first, then monitor field data as real visits accumulate.
Conclusion
PageSpeed Insights should help teams decide which performance issue matters most. The best workflow starts with field data, checks the weakest Core Web Vital, then uses lab diagnostics to guide technical fixes. This approach turns PSI from a score report into a practical SEO and UX decision tool.

NEWEST POSTS
- Advertising Industry In Vietnam: The 2026 Trends, Channels and Market-Entry Strategy
- Best SEO Company in Vietnam: Latest Shortlist For Businesses
- How To Leverage Social Media For Customer Service Like A Pro?
- Social Media Post Tips – 8 Ways To Boost Engagement
- How To Use Social Media for Sales – In-depth Beginner Guide
Read more