
PageSpeed Insights vs Lighthouse: Practical Guide for SEO and Business Decisions
Vincent
20/01/2026
46
PageSpeed Insights vs Lighthouse compares two Google performance tools with different jobs. PageSpeed Insights shows field data from Chrome UX Report plus Lighthouse lab diagnostics, while Lighthouse runs controlled audits for debugging. In 2026, SEO teams should use both to protect Core Web Vitals and improve mobile journeys that influence conversion.
What PageSpeed Insights vs Lighthouse means and when it matters
PageSpeed Insights vs Lighthouse means comparing a real-user performance tool with a lab-based audit tool. PageSpeed Insights is better for SEO monitoring because it shows field data when available. Lighthouse is better for debugging because it runs controlled tests that developers can repeat.
PageSpeed Insights reports user experience on mobile and desktop, then provides suggestions for improvement. It also uses Lighthouse for lab audits and integrates Chrome UX Report data to show how real users experience a page in aggregate.
Lighthouse is an open-source automated tool for improving web page quality. Chrome documentation describes it as a tool that can run audits for performance, accessibility, SEO, and other areas.
| Use case | Better tool | Reason |
| Check real-user Core Web Vitals | PageSpeed Insights | Uses CrUX field data when available |
| Debug a template before launch | Lighthouse | Runs repeatable lab audits |
| Report SEO performance risk | PageSpeed Insights | Easier to explain to stakeholders |
| Test staging or local pages | Lighthouse | Can run in browser or local workflows |
| Compare mobile and desktop experience | PageSpeed Insights | Shows both device views |
Use PageSpeed Insights when you need to understand user experience at scale. Use Lighthouse when the team needs to find the technical cause behind a weak score.
Why this comparison matters for SEO decisions and conversion planning
This comparison matters because tool choice changes the action plan. A weak PageSpeed Insights result may show real users are struggling. A weak Lighthouse result may show a technical issue under test conditions. SEO teams need to separate those signals before assigning development work.
Google Search Console’s Core Web Vitals report is based on actual user data for LCP, INP, and CLS. That makes field data important for SEO reporting, especially when leadership needs to understand real traffic risk rather than a one-time lab score.
Performance also affects conversion planning. A slow landing page can reduce paid campaign efficiency. A page that shifts during load can make CTA clicks harder. A page that responds slowly after tapping a filter can frustrate mobile shoppers.
A practical rule works well:
| Signal | What it usually means | Next action |
| PSI field data is poor | Real users have performance issues | Prioritize production fixes |
| Lighthouse is poor | Technical bottleneck appears in lab | Debug template or code |
| PSI is good but Lighthouse is poor | Real users may be protected by cache or device mix | Fix risks before rollout |
| Lighthouse is good but PSI is poor | Real users face conditions lab did not reflect | Check mobile, CDN, third-party scripts |
| Both are poor | User and lab signals align | Treat as high priority |
The goal is decision clarity. PageSpeed Insights shows whether performance affects real users. Lighthouse helps explain what to fix.
Core Web Vitals main metrics in more detail
Core Web Vitals are user-centered metrics that measure loading speed, responsiveness, and visual stability. In 2026, the key metrics are LCP, INP, and CLS. These metrics matter because they connect technical performance with real user experience.
Google’s Web Vitals guidance defines good thresholds as LCP within 2.5 seconds, INP at 200 milliseconds or less, and CLS at 0.1 or less.
| Metrics | What it measure | Good threshold | Business impact |
| LCP | Main content loading | ≤ 2.5 seconds | Faster first impression |
| INP | Interaction responsiveness | ≤ 200 milliseconds | Smoother forms, menus, filters |
| CLS | Visual stability | ≤ 0.1 | Fewer misclicks and layout jumps |
PageSpeed Insights is useful here because it can show field data for these metrics when the page or origin has enough CrUX data. Lighthouse remains useful because it helps developers test potential fixes before the field data updates.
This distinction is important for timelines. Lighthouse can respond right after a code change. Field data needs real user visits over time, so PSI may take longer to reflect production improvements.
Cumulative Layout Shift and why UX risk can hide behind a good score
Cumulative Layout Shift measures unexpected layout movement. A page with weak CLS can feel unstable when banners, fonts, images, ads, or embedded widgets load late. Even when the page looks fast, layout shifts can damage trust and reduce conversion intent.
CLS is especially important on mobile pages. A visitor may try to tap a button, then the layout moves before the tap lands. That creates friction even when LCP looks acceptable.
Common causes include:
- Images without reserved dimensions.
- Ads or embeds inserted after content loads.
- Web fonts changing text size after render.
- Cookie banners pushing content down.
- Late-loading review or product widgets.
Use PageSpeed Insights to see whether real users have CLS issues. Use Lighthouse to inspect the page structure and identify elements that shift under lab conditions. From there, developers can reserve space for images, stabilize ad slots, and review late-loading scripts.
How scoring works across Core Web Vitals, Lighthouse, and PageSpeed Insights
Core Web Vitals scoring focuses on real-user thresholds. Lighthouse scoring is lab-based and weighted across performance metrics. PageSpeed Insights combines both views, which is why one URL can show different results across the same testing session.
PageSpeed Insights uses Lighthouse to audit a page, while CrUX integration adds real-user context when available. The field section and lab section answer different questions, so the numbers should not be treated as duplicates.
| Score type | Data source | Best interpretation |
| PSI field data | Chrome UX Report | Real-user performance trend |
| PSI lab data | Lighthouse audit | Controlled diagnostic snapshot |
| Lighthouse score | Local or configured lab run | Debugging and regression checks |
| Search Console CWV | Field data by URL group | SEO monitoring at scale |
A common issue happens when Lighthouse is green but PSI field data is red. That usually means the page performs well in a clean lab test, while real users face weaker networks, lower-end phones, heavier third-party scripts, or geographic latency.
The reverse can also happen. Lighthouse may flag a risk that field data does not show yet. That still deserves review if the issue sits in a shared template, because future traffic or new scripts may expose the problem.
How to check throttling and test conditions
Throttling changes the test result because it controls simulated network and CPU conditions. When comparing PageSpeed Insights vs Lighthouse, always record how the test was run. Without that context, score differences can lead to the wrong fix.
Lighthouse can run in Chrome DevTools, from the command line, or inside automated workflows. Because it can run locally, the test may be affected by machine load, browser state, extensions, cache, or network conditions.
Use this QA checklist:
| Test condition | What to record |
| Tool used | PSI, DevTools Lighthouse, CLI, CI |
| Device mode | Mobile or desktop |
| Test environment | Production, staging, local |
| Cache state | Fresh test or repeat view |
| Browser state | Incognito or normal profile |
| Network setup | Simulated throttling or live connection |
| Lighthouse version | Report version number |
| Test count | Single run or median of several runs |
For business reporting, avoid using one Lighthouse run as the final truth. Run several tests, compare medians, and use PageSpeed Insights field data for production trends.
Step-by-step implementation framework for marketers and SEO teams
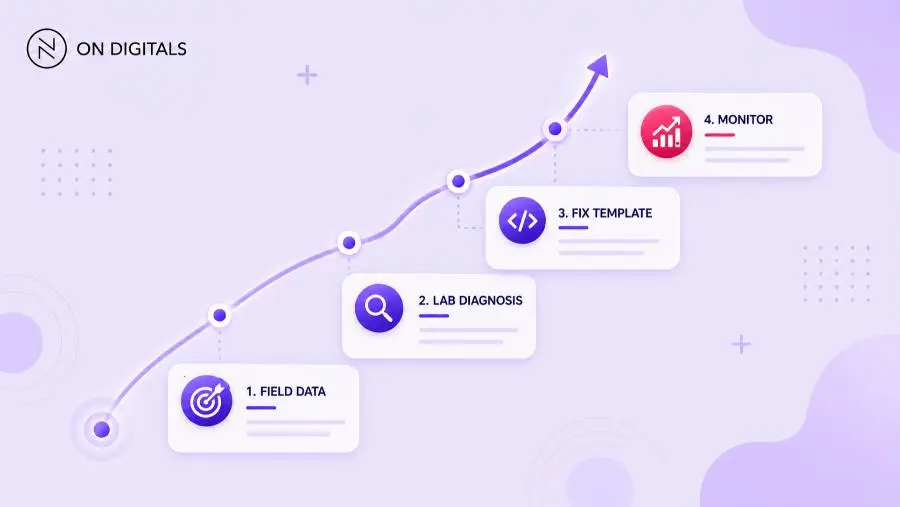
A PageSpeed Insights vs Lighthouse workflow should begin with the business page, then move into field data, lab diagnosis, prioritization, and validation. This order keeps performance work tied to SEO and conversion value.
Use this workflow:
- Choose priority URLs: Start with pages tied to leads, sales, paid traffic, or organic visibility.
- Check PageSpeed Insights first: Review mobile and desktop. Focus on field data when available.
- Identify the weakest Core Web Vital: Separate LCP, INP, and CLS issues. Each metric usually needs a different fix.
- Run Lighthouse for diagnosis: Test the same template under controlled conditions. Use opportunities and diagnostics to find causes.
- Group by template: Treat product pages, blog posts, landing pages, and service pages separately.
- Prioritize by business impact: A slow service page may deserve attention before a low-traffic blog post.
- Fix and validate in Lighthouse: Use lab tests to confirm technical improvements before release.
- Monitor PSI after deployment: Field data updates after real users experience the page. Track trends instead of one-day changes.
This workflow helps marketing and development teams use both tools without arguing over which score is “right.”
Common mistakes, risks, and quality checks
Most mistakes come from treating PageSpeed Insights and Lighthouse as interchangeable. They overlap, but they do not answer the same question. PageSpeed Insights is stronger for real-user monitoring. Lighthouse is stronger for controlled debugging.
Use this QA table before making recommendations:
| Mistake | Risk | Better action |
| Chasing 100/100 | Wastes development time | Focus on user-facing metrics |
| Testing only homepage | Misses template issues | Test money pages and key journeys |
| Trusting one lab run | High variance | Use repeated tests |
| Ignoring mobile field data | Real users stay affected | Prioritize mobile UX |
| Fixing all warnings equally | Low-impact work expands | Rank by metric and revenue impact |
| Skipping post-launch monitoring | Fixes remain unproven | Track PSI field trends |
Performance should support user outcomes. A technical fix matters most when it improves loading, responsiveness, visual stability, or conversion behavior on an important page.
Tools and metrics to review before publishing
A reliable performance workflow uses both Google tools plus supporting reports. The tool stack should help teams move from issue detection to root-cause diagnosis, then into business reporting.
| Tool | Role | Best use |
| PageSpeed Insights | Field and lab overview | SEO and stakeholder reporting |
| Lighthouse | Lab audit | Debugging and validation |
| Search Console CWV report | URL group monitoring | Site-level SEO tracking |
| Chrome DevTools | Technical inspection | Network and rendering review |
| Analytics or CRM | Business impact | Conversion prioritization |
Before publishing a major template update, check these metrics:
- LCP for the main content block.
- INP for forms, menus, filters etc.
- CLS for unstable layout elements.
- TTFB for server response.
- JavaScript execution time.
- Third-party script impact.
- Mobile field data trend.
This review helps teams avoid score-chasing. The aim is a faster, more stable experience on pages that support visibility or revenue.
FAQ about PageSpeed Insights vs Lighthouse
What is the main difference between PageSpeed Insights and Lighthouse?
PageSpeed Insights combines Lighthouse lab diagnostics with Chrome UX Report field data when available. Lighthouse runs controlled audits for performance, accessibility, SEO, and other quality checks. Use PSI to understand real-user performance. Use Lighthouse to debug technical issues.
Which tool should SEO teams trust more?
SEO teams should prioritize PageSpeed Insights field data and Search Console Core Web Vitals for production monitoring. Lighthouse remains important for diagnosis and validation. Field data reflects actual users, while lab data helps teams find what to fix.
Why are PageSpeed Insights and Lighthouse scores different?
Scores differ because the tools can use different data sources, environments, Lighthouse versions, cache states, and throttling conditions. PSI can show real-user CrUX data, while Lighthouse often reflects a controlled test run. Record the test setup before comparing scores.
Does a high Lighthouse score improve rankings?
A high Lighthouse score can indicate good technical performance, but it does not guarantee stronger rankings. Google’s Core Web Vitals reporting uses actual user data, and rankings also depend on content relevance, intent match, authority, and other search systems.
Should businesses chase a 100 score?
A perfect score is rarely the right business target. Focus on Core Web Vitals thresholds, mobile experience, and conversion-critical user journeys. A site can spend too much development time chasing small lab gains while larger field issues remain.
How often should teams check PageSpeed Insights and Lighthouse?
Check PageSpeed Insights monthly for important templates, then more often after launches or large script changes. Use Lighthouse during development sprints, staging QA, and regression checks. For high-revenue landing pages, monitor after every major release.
Conclusion
PageSpeed Insights vs Lighthouse is not a choice between two competing tools. PageSpeed Insights shows how real users experience important pages, while Lighthouse helps teams diagnose and validate technical fixes. Used together, they create a clearer workflow from SEO risk to development action.

NEWEST POSTS
- Advertising Industry In Vietnam: The 2026 Trends, Channels and Market-Entry Strategy
- Best SEO Company in Vietnam: Latest Shortlist For Businesses
- How To Leverage Social Media For Customer Service Like A Pro?
- Social Media Post Tips – 8 Ways To Boost Engagement
- How To Use Social Media for Sales – In-depth Beginner Guide
Read more