
Insights
PageSpeed Insights vs Lighthouse: Key Differences, Use Cases, and Best Practices
On Digitals
20/01/2026
46
In today’s digital landscape, website performance directly impacts search rankings, user experience, and business results, making it essential to understand the differences between PageSpeed Insights vs Lighthouse. Although both tools are developed by Google and use similar metrics, they serve different purposes and deliver distinct insights into website performance.
This guide helps clarify when to use each tool and how to combine them effectively, whether you are an SEO specialist tracking Core Web Vitals, a developer fixing performance issues, or a business owner aiming for faster load times and sustainable optimization.
Introduction: The importance of web performance in the modern era
The way users interact with websites has fundamentally changed over the past decade. Mobile browsing has overtaken desktop usage, internet speeds vary dramatically across regions, and user patience has worn thin. In this environment, web performance has emerged as a non-negotiable element of digital success, influencing everything from search visibility to conversion rates.
Why page speed is non-negotiable for SEO and UX
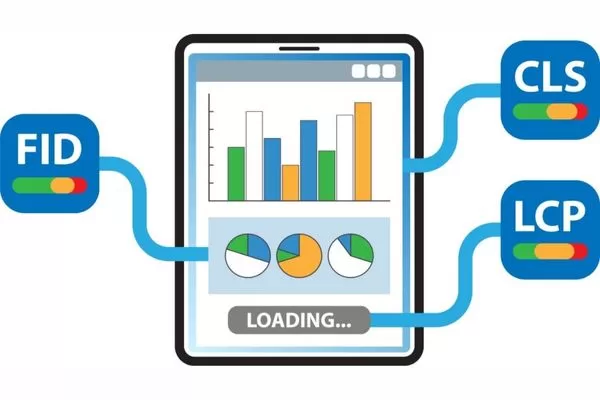
Page speed has evolved from a technical nicety to a business imperative. Google’s introduction of Core Web Vitals as official ranking signals in 2021 cemented performance as a crucial SEO factor. These metrics measure real-world user experience and directly impact how search engines evaluate your site:
- Largest Contentful Paint (LCP): Measures loading performance.
- Interaction to Next Paint (INP): Measures responsiveness.
- Cumulative Layout Shift (CLS): Measures visual stability.

Page speed directly impacts SEO, user experience, and conversions
The connection between speed and user behavior is equally compelling. Research consistently shows that users abandon sites that take longer than three seconds to load, with every additional second of delay resulting in measurable drops in engagement and conversions. For e-commerce sites, a one-second delay can reduce conversions by up to 7%. Beyond rankings and revenue, fast-loading pages enhance accessibility, improve mobile experiences, and build trust with visitors.
Understanding and optimizing for page speed isn’t purely technical work. It is strategic business optimization that touches marketing, development, and customer experience simultaneously.
The common confusion: Google Lighthouse vs PageSpeed Insights
Despite both tools originating from Google and sharing overlapping metrics, the distinction between Google Lighthouse vs PageSpeed Insights remains a source of persistent confusion. Both display performance scores out of 100, both measure Core Web Vitals, and both provide recommendations for improvement. This surface-level similarity leads many professionals to treat them as interchangeable when they are actually complementary tools serving different analytical purposes.
The confusion deepens when users notice score discrepancies between the two platforms. A website might score 95 on Lighthouse while receiving only 60 on PageSpeed Insights, creating uncertainty about which result to trust and act upon.
Choosing the right tool for your specific use case matters tremendously. Using Lighthouse when you need field data insights, or relying solely on PageSpeed Insights for development debugging, can lead to missed optimization opportunities and misguided priorities. Clarity on these distinctions empowers you to make better decisions throughout your optimization workflow.
Note: These variations are not errors. They reflect fundamental differences in how each tool collects and analyzes data.
Understanding the basics: What are Google Lighthouse vs PageSpeed Insights?
Before diving into differences and applications, it’s essential to understand what each tool actually is and what it was designed to accomplish. While both measure web performance, their underlying architectures, data sources, and intended audiences differ significantly.
Defining Google Lighthouse
Google Lighthouse is an open-source, automated auditing tool designed primarily for developers and technical professionals. It runs entirely in a simulated, controlled environment. This is typically within Chrome DevTools, from the command line, or as part of continuous integration pipelines.
Lighthouse generates comprehensive reports covering five distinct categories:
- Performance: Speed and efficiency.
- Accessibility: Usability for people with disabilities.
- Best Practices: Security and modern web standards.
- SEO: Search engine optimization basics.
- Progressive Web App (PWA): Mobile-app-like capabilities.

Google Lighthouse is a lab-based website audit tool
The tool’s strength lies in its diagnostic capabilities. When Lighthouse audits a page, it simulates specific device and network conditions by throttling CPU and bandwidth to mimic lower-end devices and slower connections. This controlled environment ensures reproducible results that help developers identify specific technical issues, measure the impact of code changes, and validate optimizations before deployment.
Lighthouse’s open-source nature means it is highly extensible and continuously updated by the community. Developers can customize audit configurations, integrate Lighthouse into automated testing workflows, and even create custom audits tailored to specific requirements. This flexibility makes Lighthouse an indispensable tool for performance-conscious development teams.
Defining Google PageSpeed Insights (PSI)
Google PageSpeed Insights is a performance analysis tool that bridges the gap between technical audits and real-world user experience. Unlike the simulated environment of Lighthouse, PageSpeed Insights combines two data sources: Lab data (powered by Lighthouse) and Field data from the Chrome User Experience Report (CrUX).
This hybrid approach provides both diagnostic insights and actual user experience metrics:
- The Field Data Distinction: This component is what sets PageSpeed Insights apart. CrUX collects anonymized performance metrics from real Chrome users visiting your site over the past 28 days. This means PageSpeed Insights reflects how actual visitors experience your site under real-world conditions including varying devices, network speeds, geographic locations, and usage patterns.
- Strategic Value for SEO: For SEO professionals, this field data is particularly valuable because it represents the same metrics Google uses for ranking purposes.
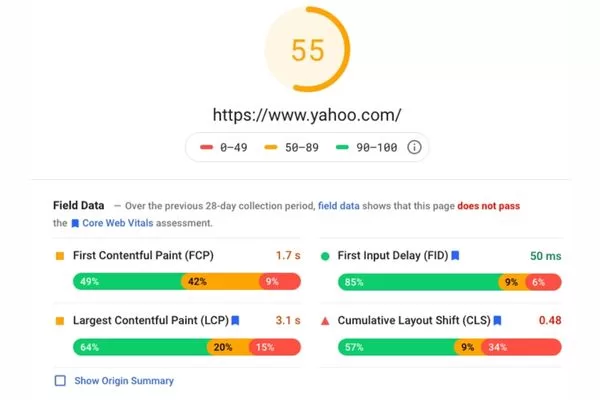
Google PageSpeed Insights reflects real user performance data used for SEO
PageSpeed Insights presents this data through an accessible web interface at pagespeed.web.dev, making it easy for non-technical stakeholders to understand performance status. The tool provides both mobile and desktop scores, highlights Core Web Vitals performance, and offers actionable recommendations for improvement. While it uses Lighthouse under the hood for lab testing, its primary value lies in showing whether real users are experiencing good performance.
PageSpeed Insights vs Lighthouse differences: 3 core distinctions
Understanding the PageSpeed Insights vs Lighthouse differences requires examining three fundamental distinctions that shape how each tool operates and what insights they provide. These differences aren’t just technical nuances—they determine which tool you should use for specific optimization scenarios.
Data sources: Lab data vs field data (the crux)
The most critical distinction between these tools lies in their data sources.
- Lighthouse: Exclusively uses lab data. This means it tests your site in a controlled, simulated environment with predefined conditions. Every test runs on the same virtual device with identical network throttling to produce consistent and reproducible results. This approach is perfect for debugging because it isolates performance issues from external variables.
- PageSpeed Insights: Conversely, provides both lab data and field data. The lab component runs Lighthouse in Google’s testing infrastructure, while the field component displays real-user metrics from the Chrome User Experience Report (CrUX). This field data reveals how actual visitors experience your site across diverse conditions such as different devices, connection speeds, and geographic locations.

Lighthouse uses lab data, while PageSpeed Insights includes real user field data
For SEO purposes, field data is paramount. Google’s ranking algorithms evaluate sites based on real-user experiences captured through CrUX rather than simulated lab conditions. While a site might score perfectly in a controlled environment, it could still fail to deliver good experiences for actual users on slower connections.
The practical implication is straightforward: use PageSpeed Insights to understand how your site performs for real users and impacts SEO, while using Lighthouse to diagnose technical issues and validate optimizations during development.
Scope of audits
While both tools measure performance, their audit scope differs substantially.
PageSpeed Insights focuses primarily on performance metrics and Core Web Vitals. Its reports highlight LCP, INP, CLS, and other speed-related measurements to provide targeted recommendations for improving load times and interactivity.
Lighthouse, however, offers a much broader audit scope across five categories:
- Performance: Speed and efficiency.
- Accessibility: Compliance with ARIA labels, color contrast, and keyboard navigation.
- Best Practices: HTTPS usage, console errors, and modern web standards.
- SEO: Basic factors like meta tags, crawlability, and mobile-friendliness.
- PWA: Service workers, offline functionality, and installability.
Lighthouse has broader audits, while PageSpeed Insights focuses on performance
For professionals managing PageSpeed Insights vs Lighthouse workflows, Lighthouse serves as your comprehensive development audit tool. Meanwhile, PageSpeed Insights functions as your performance monitoring and SEO validation platform.
Execution environment
The environments where these tools run create another fundamental distinction.
- PageSpeed Insights executes all tests from Google’s distributed server infrastructure. When you submit a URL for analysis, Google’s servers fetch your page and run both Lighthouse audits and field data queries from their controlled environment. You have no influence over the testing location or device specifications beyond selecting mobile or desktop analysis.
- Lighthouse, in contrast, runs locally in your own environment. Whether you are using Chrome DevTools, the Lighthouse CLI, or a CI/CD integration, the tool executes within your browser or system. This means your computer’s CPU performance, available memory, and network connection directly affect test results.
PageSpeed Insights runs tests from Google’s server infrastructure
This environmental difference explains why the same page might receive different scores from each tool. When comparing PageSpeed Insights vs Lighthouse results, remember that PSI scores come from standardized Google infrastructure, while Lighthouse scores reflect your local testing conditions. Crucially, Lighthouse’s local execution allows you to test staging sites or local servers that PageSpeed Insights cannot access.
Deep dive: Why are PageSpeed Insights vs Lighthouse scores different?
One of the most common questions professionals ask is why their PageSpeed Insights vs Lighthouse scores differ, sometimes dramatically, for the same URL tested at the same time. These variations aren’t random—they result from specific technical factors that affect how each tool measures and reports performance.
Network throttling and CPU simulation
Both tools simulate network conditions and device capabilities, but their configurations differ:
- Lighthouse: Applies network throttling that simulates a 4G mobile connection with 150ms latency while also throttling CPU to mimic a mid-range mobile device. These settings are configurable when running Lighthouse locally, allowing developers to test under various conditions from fast 5G to slow 3G networks.
- PageSpeed Insights: Runs Lighthouse with Google’s standardized configuration. However, the actual network conditions between Google’s servers and your site vary based on server location, CDN performance, and routing. Furthermore, because PSI tests run on Google’s infrastructure rather than your local machine, the simulated CPU throttling reflects their standardized testing environment rather than your device’s actual hardware performance.
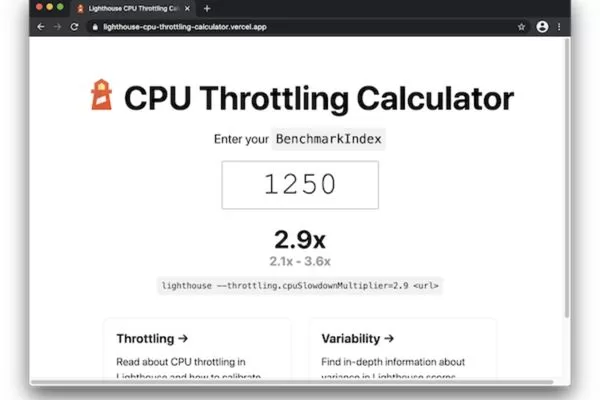
Lighthouse and PageSpeed Insights simulate performance differently
Simulation differences mean that a site optimized for Google’s testing conditions might show excellent PSI scores while revealing issues when tested locally with Lighthouse under different throttling configurations.
Geographic and latency factors
Geographic distance between testing infrastructure and your servers significantly impacts performance measurements, particularly in PageSpeed Insights. When Google’s servers in a specific region (e.g., North America) test a site hosted in Europe, the inherent network latency differs from testing a US-hosted site. This geographic factor affects Time to First Byte (TTFB), resource download speeds, and overall performance scores.
Lighthouse reflects the network conditions between your physical testing location and the target server. A developer in New York testing a New York-hosted site will see faster connection times than the same developer testing a Tokyo-hosted site.
Note: Content Delivery Networks (CDNs) play a crucial role here. A well-configured CDN serves assets from edge locations close to users, reducing geographic latency impact.
The impact of browser extensions and state
When running Lighthouse locally through Chrome DevTools, your browser’s state significantly affects results:
- Extensions: Installed extensions, even when running in the background, can impact performance measurements by injecting scripts or consuming memory.
- System Load: Background processes consuming CPU resources on your local machine alter throttling effectiveness.
- Local State: Browser cache, cookies, and local storage from previous visits change how pages load if not properly cleared.

Local browser state and system load affect Lighthouse results
PageSpeed Insights avoids these issues by running on Google’s controlled infrastructure. Each test executes in a fresh environment without extension interference or state pollution. This consistency is valuable for benchmarking but comes at the cost of flexibility, as you cannot test authenticated pages or local development servers.
Version discrepancies
The Lighthouse engine powering both tools is continuously updated with improved metrics and refined scoring algorithms. However, different platforms often run different Lighthouse versions. Chrome DevTools might use an older version of Lighthouse integrated into the current Chrome release, while PageSpeed Insights is often the first to be upgraded to the latest Lighthouse engine.
Version differences can significantly impact scores because each release recalibrates metric weights or introduces new measurement methodologies. A site scoring 90 on Lighthouse 10 might score 75 on Lighthouse 11 simply due to algorithmic changes, even if the site itself remains unchanged. When comparing Google Lighthouse vs PageSpeed Insights scores, always check the version information provided in both reports.
Practical application: When to use which tool?
Understanding the theoretical differences between these tools is valuable, but practical application comes down to knowing which tool serves which purpose in your optimization workflow. Both PageSpeed Insights and Lighthouse have optimal use cases where they provide maximum value.
Using PageSpeed Insights for SEO monitoring
PageSpeed Insights is the superior choice for SEO professionals monitoring Core Web Vitals and understanding how real users experience their sites. The field data component directly reflects the metrics Google uses for ranking decisions, making PSI the authoritative source for SEO-related performance monitoring. When reporting to stakeholders, clients, or management, PageSpeed Insights scores carry more weight because they represent actual user experiences rather than simulated conditions.
PageSpeed Insights is best for SEO and real-user Core Web Vitals
Use PageSpeed Insights when you need to answer questions like:
- “Are we passing Core Web Vitals for our real users?”
- “How does our mobile performance compare to desktop?”
- “What percentage of real users experience good LCP?”
The tool’s web-based interface also makes it accessible for non-technical team members who need visibility into performance status. Marketing managers and executives can check PageSpeed Insights without technical setup. For regular monitoring, track field data trends over time for your most important pages such as the homepage and key landing pages.
Using Google Lighthouse for development and debugging
Lighthouse excels during development, debugging, and technical optimization work. Its controlled testing environment produces consistent results that allow developers to measure the impact of specific code changes accurately. When you optimize an image or defer a script, Lighthouse quickly validates the improvement without waiting 28 days for field data to accumulate.
Key benefits for the development lifecycle:
- Comprehensive Scope: Run audits on staging sites to catch accessibility, SEO, and security issues before they reach production.
- Automation: Use the command-line interface to enable automation through CI/CD pipelines, preventing performance regressions.
- Granular Feedback: The Opportunities and Diagnostics sections identify technical issues and quantify potential savings, helping prioritize work based on expected impact.
The perfect workflow
The most effective approach combines both tools in a complementary workflow that leverages each tool’s strengths.
- Identify (PSI): Start with PageSpeed Insights to establish your baseline real-world performance and identify whether Core Web Vitals need attention.
- Diagnose (Lighthouse): If field data shows issues, dig deeper with Lighthouse to diagnose specific technical problems and test potential solutions.
- Validate (Lighthouse): During optimization sprints, use Lighthouse iteratively to test each change. Verify improvements on local or staging environments before deploying to production.
- Confirm (PSI): Once deployed, monitor PageSpeed Insights field data over the following weeks to confirm real-user benefits.

Use PageSpeed Insights and Lighthouse together in a complementary workflow
This workflow creates a powerful feedback loop: PSI identifies problems affecting real users, Lighthouse diagnoses root causes, Lighthouse validates fixes in development, and PSI confirms improvements in production. This clarity ensures that performance optimization efforts focus on changes that genuinely improve user experiences rather than just lab scores.
Best practices for professional performance optimization
Moving beyond tool selection, professional performance optimization requires a strategic approach that prioritizes user experience over arbitrary metrics. Understanding these best practices ensures your optimization efforts drive meaningful business results rather than just better scores.
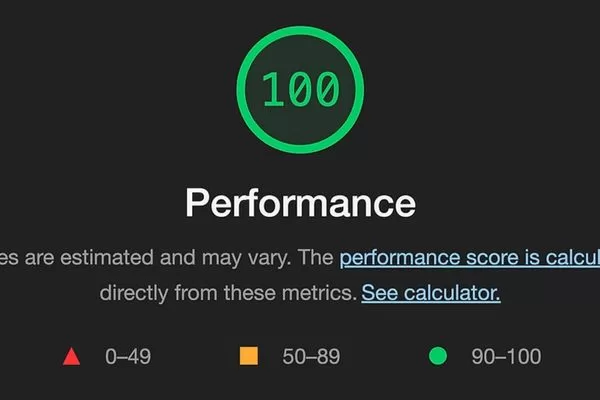
Moving beyond the “100/100” score myth
One of the most persistent misconceptions in web performance is that achieving a perfect 100/100 score on Lighthouse or PageSpeed Insights should be the primary goal. This pursuit is not only unrealistic for most real-world sites but potentially counterproductive. Perfect scores often require sacrifices that harm actual user experience by removing legitimate functionality, compromising design, or over-optimizing for testing conditions rather than real usage patterns.
What truly matters are the underlying user-centric metrics (Core Web Vitals):
- Largest Contentful Paint (LCP): Measuring load performance.
- Interaction to Next Paint (INP): Measuring interactivity.
- Cumulative Layout Shift (CLS): Measuring visual stability.
Perfect scores matter less than meeting Core Web Vitals thresholds
Google’s documentation explicitly states that “Good” performance does not require perfect scores. The targets for the 75th percentile of real-user visits are an LCP under 2.5 seconds, INP under 200 milliseconds, and CLS under 0.1. Focus your efforts on crossing these “Good” thresholds rather than chasing a perfect audit score under simulated conditions.
Analyzing opportunities and diagnostics
Both PageSpeed Insights and Lighthouse provide extensive recommendations, but not all suggestions carry equal weight.
- The Opportunities Section: This part quantifies potential time savings for each recommendation. Use it to prioritize high-impact optimizations over minor tweaks. A suggestion saving 2 seconds deserves immediate attention, while one saving 0.1 seconds might not be worth significant development effort.
- The Diagnostics Section: This identifies technical issues like excessive DOM size or render-blocking resources. While these do not show direct time savings, addressing them improves performance stability and future-proofs your site against degradation.
When reviewing recommendations, consider implementation complexity versus expected impact. Quick wins like image compression should be prioritized. Avoid the trap of treating all “red” items as critical or all “green” items as perfect. Make informed decisions based on your specific site needs rather than blindly following a checklist.
Ensuring test reliability
Performance testing is inherently variable due to network conditions and server load. To make reliable decisions based on PageSpeed Insights vs Lighthouse data, you must follow testing best practices that account for this variability:
- Multiple Test Runs: Never base optimization decisions on a single test. Always perform multiple tests and analyze the median or distribution of results.
- Consistent Conditions: For Lighthouse testing, use Incognito mode, close unnecessary applications, and use a stable network connection.
- Track Trends: Focus on performance trends over time rather than absolute scores. A steady decline from 85 to 65 over several weeks indicates a genuine regression that requires investigation.
- Test Representative Pages: Do not just test your homepage. Performance varies significantly between blog posts, product pages, and checkout flows. Ensure your most important user journeys receive proper attention.
Focus on trends, not single test results
FAQs: Common queries on PageSpeed Insights vs Lighthouse
Certain questions about these tools arise repeatedly in professional contexts. Addressing these common queries helps clarify persistent confusion and provides practical guidance for specific scenarios.
Why does my Lighthouse score change every time I run it?
Lighthouse scores often fluctuate due to changes in CPU usage, network conditions, browser state, and dynamic site behavior, which commonly results in a 5–10 point variation. To reduce noise, test in Incognito mode, close background apps, and run multiple tests using median scores, while ignoring small 3–5 point changes. For consistent long-term tracking, PageSpeed Insights field data is more reliable because it reflects aggregated real-world experiences over a 28-day period rather than single test results.
If my PSI score is “Red” but Lighthouse is “Green,” which one should I trust?
When PageSpeed Insights shows poor results but Lighthouse scores well, prioritize the PageSpeed Insights field data for SEO and user experience. This gap usually means the site performs well in lab conditions but struggles for real users due to factors like slow networks, geographic latency, mobile traffic, third-party scripts, or server load. Use Lighthouse to simulate those challenging conditions and fix technical issues, then track PageSpeed Insights field data over time to confirm real-world performance improvements.
Prioritize PageSpeed Insights when lab and real-user results conflict
Can a high Lighthouse score guarantee a ranking boost?
A high Lighthouse score alone does not guarantee better search rankings, as Google prioritizes content relevance, search intent, and authority over lab-based performance metrics. While Core Web Vitals are ranking factors, they matter most when content quality is comparable and performance acts as a tiebreaker. Since rankings rely on real-user CrUX field data shown in PageSpeed Insights rather than Lighthouse lab scores, performance optimization should be seen as a way to improve user experience, engagement, and conversions, which indirectly support stronger SEO results.
Conclusion: Mastering PageSpeed Insights vs Lighthouse for sustainable growth
Understanding the different roles of PageSpeed Insights vs Lighthouse helps turn performance data into a clear, actionable optimization strategy. PageSpeed Insights reflects real user experiences and SEO impact through Core Web Vitals, while Lighthouse acts as a diagnostic tool that uncovers technical issues and optimization opportunities in controlled testing environments.
For sustainable results, both tools should be used together in a continuous workflow. Use PageSpeed Insights to detect real-world performance problems, rely on Lighthouse to diagnose and fix their root causes, and then confirm improvements through ongoing PSI monitoring. By focusing on user-centric outcomes rather than chasing arbitrary scores, mastering the synergy between PageSpeed Insights vs Lighthouse leads to faster websites, better search visibility, and stronger business growth.
In a rapidly evolving digital landscape, staying up to date with the latest trends is key to maintaining a competitive edge. Visit the On Digitals website to access in-depth insights on Digital Marketing. If you are looking for breakthrough solutions to elevate your brand’s search rankings, our team of SEO experts is always ready to support you.
Read more