
ROAS vs ROI: How to Scale Paid Campaigns Without Losing Profit
Vincent
02/09/2025
46
ROAS and ROI answer different questions about paid media performance. ROAS shows the conversion value generated for each advertising dollar. ROI shows the return left after the agreed cost base is accounted for. Before choosing a target, it helps to understand what a good ROAS looks like for the margin model and the role of the campaign. Used together, these metrics help teams decide which campaigns deserve more budget and where profit pressure needs attention.
ROAS vs ROI at a glance
ROAS is useful when a campaign owner needs to improve account performance. ROI becomes more important when a marketing lead needs to assess whether the wider investment supports profitable growth. Both metrics matter, although they answer different business questions.
|
Area |
ROAS |
ROI |
|
Full name |
Return on ad spend |
Return on investment |
|
Formula |
Attributed conversion value ÷ ad spend |
Net profit ÷ total investment × 100 |
|
Typical format |
Ratio, such as 4x |
Percentage, such as 25% |
|
Main question |
How efficiently did advertising generate value? |
Did the full investment create an acceptable return? |
|
Cost scope |
Advertising spend |
Defined cost base |
|
Best review cadence |
Daily or weekly |
Monthly or by payback period |
|
Typical owner |
PPC specialist |
Marketing lead or finance team |
A campaign can report strong ROAS while ROI remains weak. Thin margins, high fulfilment costs, aggressive discounting, or campaign support costs can create that gap.
What ROAS measures in a paid campaign
ROAS measures the conversion value attributed to advertising against the spend required to generate it. A 4x ROAS means each $1 spent on ads created $4 in attributed conversion value.
ROAS formula:
Attributed conversion value ÷ ad spend = ROAS
Assume a Google Search campaign spends $5,000 and generates $25,000 in tracked purchase revenue.
$25,000 ÷ $5,000 = 5x ROAS
The campaign generated five dollars in attributed revenue for each advertising dollar. The result does not reveal how much profit remains after product cost, returns, payment fees, or campaign execution costs are deducted.
Conversion value shapes the ROAS result
ROAS is only as useful as the conversion value passed into the ad platform. An ecommerce account may use transaction revenue. A B2B account may assign a value to a sales-qualified lead based on previous CRM outcomes.
Google Ads allows conversion values to represent sales revenue or profit margins. Its value-based bidding strategies then optimise towards the values supplied to the account. See Google’s guidance on conversion values and Target ROAS for the platform-level setup.
For example, a software company might assign $5,000 to every demo request. Historical CRM data may later show that the average gross profit from a closed customer is much lower. In that situation, the campaign could appear efficient in the ad platform while the commercial value model needs review.
ROAS is most useful when the next decision concerns a campaign, audience segment, keyword group, creative angle, or landing page. A rapid drop may point to weaker traffic quality. A steady improvement can support a controlled increase in spend when lead or purchase quality remains stable.
What ROI measures beyond advertising spend
ROI measures the return that remains after the relevant investment has been included. The metric becomes useful when its cost scope is clear and consistent.
ROI formula:
Net profit ÷ total investment × 100 = ROI
Suppose a business spends $20,000 across media, campaign production, and direct support. The activity generates $30,000 in profit after those costs have been deducted.
$30,000 ÷ $20,000 × 100 = 150% ROI
The same campaign can show a different ROI figure when the calculation includes another set of costs. That is why a report should state its scope before comparing results across months.
Define the cost scope before calculating ROI
The cost base depends on the decision behind the report. A campaign review may focus on direct costs. A leadership view may need a broader commercial calculation.
|
Reporting purpose |
Costs commonly included |
|
Campaign ROI |
Ad spend, direct campaign work, landing-page production |
|
Ecommerce profitability |
Ad spend, product cost, fulfilment, payment fees, returns |
|
B2B acquisition ROI |
Ad spend, sales support, CRM tools, campaign work, gross margin from closed revenue |
|
Wider marketing ROI |
Channel cost, staff allocation, agency support, production cost |
A finance-ready report should also state the attribution window, source of revenue, and reporting period. That context makes the percentage more meaningful.
Why a high ROAS can still produce negative ROI
A 5x ROAS can look strong in an advertising dashboard. The full calculation may tell a different story once direct costs and campaign support are included.
Consider this ecommerce example:
|
Calculation |
Amount |
|
Attributed revenue |
$50,000 |
|
Ad spend |
$10,000 |
|
ROAS |
5x |
|
Product cost and fulfilment |
$29,000 |
|
Payment fees and returns |
$5,000 |
|
Campaign production and management |
$7,000 |
|
Total cost |
$51,000 |
|
Net profit |
-$1,000 |
|
ROI |
-2.0% |
The campaign created five dollars in attributed revenue for every media dollar. Yet the total cost exceeded the sales revenue. Improving ad efficiency may help, while the wider business also needs to inspect margin, fulfilment expense, product pricing, or discounting policy.
A B2B example: moderate ROAS with strong commercial return
A B2B software company spends $12,000 on paid search. The campaign produces five sales-qualified leads. Based on CRM history, each qualified lead has an expected gross-profit value of $7,000.
$35,000 conversion value ÷ $12,000 ad spend = 2.9x ROAS
A 2.9x ROAS may look less attractive than a 5x ecommerce result. Three months later, one lead closes and contributes $48,000 in gross profit. Campaign work and sales support cost another $4,000.
($48,000 − $16,000) ÷ $16,000 × 100 = 200% ROI
The early ROAS view helps the PPC team compare lead sources. The later ROI view shows whether the acquisition model supports profitable growth. B2B reporting needs a suitable review window because the sales cycle may delay the final outcome.
Calculate break-even ROAS before increasing spend
Break-even ROAS shows the minimum revenue required to cover advertising spend after direct variable costs are considered. It gives ecommerce teams a more useful reference point than a generic benchmark.
Break-even ROAS formula:
1 ÷ pre-ad contribution margin = break-even ROAS
Pre-ad contribution margin is the revenue left after direct variable costs. These costs may include product cost, fulfilment, transaction fees, expected returns, and discount impact.
Assume a product generates $100 in revenue. After direct variable costs, $30 remains before media spend.
1 ÷ 0.30 = 3.33x break-even ROAS
At 3.33x, the campaign covers advertising spend under that margin assumption. Most businesses need an operating target above break-even because returns, tracking variance, and cost changes can reduce the final result.
A B2B team can use a similar model based on expected gross profit. The calculation should include:
- Qualified-lead rate
- Opportunity rate
- Close rate
- Gross profit per closed customer
This turns lead volume into expected commercial value. It also helps the team set an allowable cost per lead before increasing investment.
Which metric should guide each decision?
ROAS works best for campaign-level optimisation. ROI is better suited to decisions about budget, margin, and long-term channel viability.
|
Decision |
Primary metric |
Supporting evidence |
Practical action |
|
Test a new creative angle |
ROAS |
Conversion rate |
Keep, refine, or pause the test |
|
Shift spend between campaigns |
ROAS |
Value quality, spend trend |
Move budget towards stronger segments |
|
Compare lead sources |
ROAS |
Qualified-lead rate |
Prioritise sources with better pipeline quality |
|
Expand a product campaign |
ROI |
Margin, return rate, stock capacity |
Scale gradually when profit remains healthy |
|
Review a new acquisition channel |
ROI |
Payback period, sales-cycle length |
Continue, redesign, or stop investment |
The campaign with the highest ROAS does not always deserve the highest budget. Sales capacity, inventory position, margin, and user-path quality can change the commercial value of scaling.
Build a ROAS-to-ROI reporting workflow
Campaign dashboards can update quickly. Profitability needs a longer review window. A reporting workflow helps teams act on early signals without confusing account-level efficiency with commercial return.
1. Define the conversion value model
Confirm what each conversion is worth before setting performance targets. Ecommerce teams can use transaction revenue or margin-adjusted values. Lead-generation teams should use CRM outcomes to distinguish a raw enquiry from a qualified opportunity.
2. Track the full user path
The reporting model should show how a user moves from ad click to conversion. In B2B, that path can continue through qualification, opportunity creation, sales acceptance, and closed revenue.
For ecommerce, GA4 does not collect ecommerce events automatically. Events such as add_to_cart, begin_checkout, and purchase need to be sent from the website or app. Google outlines the implementation process in its GA4 ecommerce event setup guide.
3. Set a stable ROI cost scope
Agree on the costs that will appear in the ROI calculation before reporting begins. Keep the definition stable through each review period. A cost-scope change can make performance look better or worse without any change in campaign quality.
4. Separate weekly optimisation from monthly profitability review
Weekly ROAS reporting helps a PPC owner respond to a bidding issue, weak audience segment, or a declining landing-page conversion rate. Monthly ROI reporting gives commercial stakeholders time to include returns, pipeline progression, sales outcomes, and wider execution costs.
5. Record the evidence behind major decisions
A budget increase should have a clear reason. Record the affected campaign, ROAS trend, margin assumption, and the date when ROI will be reassessed. This gives future reporting a stronger decision trail.
Use the four-layer profitability check
ROAS and ROI become more useful when teams separate attribution, media efficiency, contribution, and commercial return.
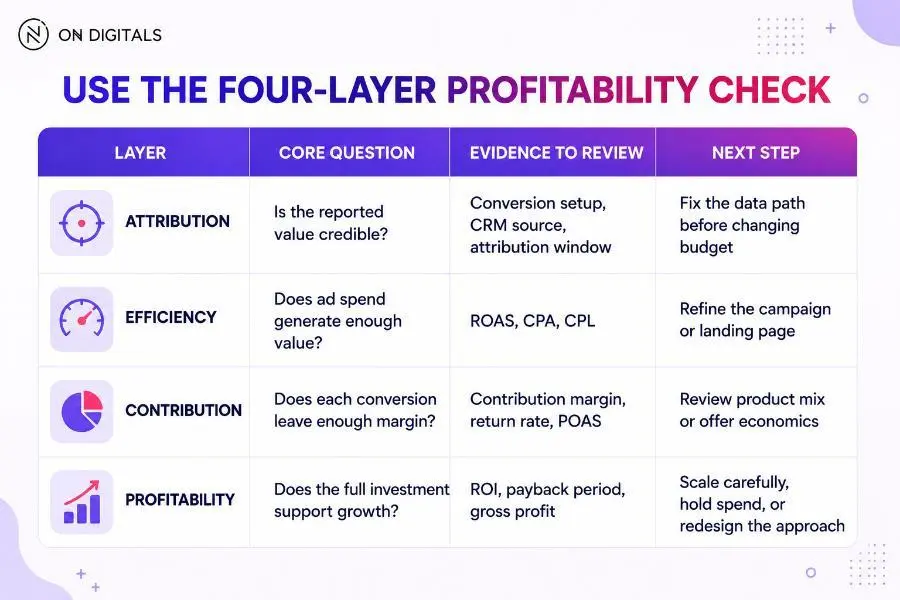 Review attribution, media efficiency, contribution, and profitability before deciding whether to scale, hold, or redesign a campaign.
This framework prevents a common reporting conflict. The PPC team may see efficient media performance. The commercial team may see weak profitability. Both views can be valid because they measure different layers of the same growth system.
What to do when ROAS and ROI disagree
A gap between ROAS and ROI can reveal where the underlying issue sits.
|
ROAS |
ROI |
Likely issue |
Recommended review |
|
High |
High |
Efficient campaign with healthy economics |
Scale through controlled budget increases |
|
High |
Low |
Margin pressure or missing campaign costs |
Review contribution margin and cost scope |
|
Low |
High |
Attribution lag, blended demand, or strong lifetime value |
Validate CRM data before cutting spend |
|
Low |
Low |
Weak traffic quality, weak offer, or user-path friction |
Review targeting, page experience, tracking, and sales follow-up |
The mismatch is a diagnostic signal. The next action should address the layer creating the gap.
Metrics that explain ROAS and ROI
ROAS and ROI provide the core view. Supporting metrics help explain why performance changes.
|
Business model |
Useful metric |
What it clarifies |
|
Ecommerce |
Contribution margin |
Revenue remaining after direct variable cost |
|
Ecommerce |
Return rate |
Whether tracked revenue is likely to hold |
|
Ecommerce |
POAS |
Profit generated for each ad dollar |
|
B2B lead generation |
Cost per qualified lead |
Whether cheap forms become viable conversations |
|
B2B lead generation |
Opportunity rate |
How well qualified leads progress in the CRM |
|
B2B lead generation |
Gross profit per closed customer |
The commercial value of a successful acquisition |
|
Any paid channel |
Payback period |
How long it takes to recover the investment |
Common ROAS and ROI reporting mistakes
Several reporting habits make paid-media performance harder to interpret:
- Treating attributed revenue as profit
- Applying one ROAS target across every product or campaign
- Changing the ROI cost scope between reporting periods
- Assigning the same value to every lead
- Reviewing B2B performance before the sales cycle matures
- Increasing spend before margin or sales capacity can support growth
A reliable model gives the campaign owner, marketing lead, and commercial team a shared basis for the next decision.
Frequently asked questions about ROAS vs ROI
Is ROAS the same as ROI?
ROAS and ROI measure related but different outcomes. ROAS compares attributed conversion value with advertising spend. ROI compares net profit with the agreed investment base. A campaign can produce efficient ROAS while a wider ROI calculation falls because margins are low or campaign costs reduce the return.
What is a good ROAS?
A viable ROAS target depends on contribution margin, attribution method, growth stage, and campaign role. One business may need 3x ROAS to cover direct costs. Another may require 6x because the margin is tighter. Calculate break-even ROAS before setting an operating target.
Can a high ROAS campaign lose money?
Yes. A high ROAS shows that advertising created conversion value efficiently. Product costs, returns, fulfilment, sales support, and campaign execution can reduce profit. ROI reveals the impact of those costs once they are included in the agreed calculation.
How should B2B teams calculate ROAS?
B2B teams should value leads according to their progression through the CRM. Historical data can show how leads become opportunities, then closed customers. Use expected gross profit from those outcomes to assign conversion value rather than treating every form submission as equally valuable.
Can Target ROAS optimize for profit?
Target ROAS can support profit-focused optimization when the value sent to the ad platform reflects margin or expected gross profit. Full revenue and generic lead estimates can still be useful, although bidding will optimise towards those inputs rather than an independently verified profit figure.
Which costs should be included in ROI?
The appropriate cost scope depends on the reporting purpose. Campaign ROI may include media cost plus direct campaign work. A wider commercial calculation can include fulfilment, returns, sales support, technology cost, or other operational inputs. State the scope clearly before comparing results.
Conclusion
ROAS shows which campaigns generate efficient conversion value. ROI shows whether that value supports profitable growth after margin and campaign costs are considered.
On Digitals helps businesses connect paid media performance with lead quality, conversion value, and clearer budget decisions through PPC management services.

NEWEST POSTS
- Advertising Industry In Vietnam: The 2026 Trends, Channels and Market-Entry Strategy
- Best SEO Company in Vietnam: Latest Shortlist For Businesses
- How To Leverage Social Media For Customer Service Like A Pro?
- Social Media Post Tips – 8 Ways To Boost Engagement
- How To Use Social Media for Sales – In-depth Beginner Guide
Read more