
SEO Data Analysis: A Practical Google Sheets Workflow for Businesses
Vincent
13/07/2023
27
SEO data analysis is the process of interpreting search data to understand why SEO performance changes over time. It combines insights from sources such as Google Search Console, GA4, and CRM systems with local market context to turn data into actionable decisions.
SEO data analysis is not the same as SEO reporting
SEO reporting shows what happened; SEO data analysis explains why it happened and what to do next. A report might say organic clicks dropped 18%. Analysis should isolate whether the cause was lower impressions, weaker CTR, ranking loss, indexation issues, seasonality, tracking errors, SERP features, AI Overviews, or lower demand.
For a foreign business entering Vietnam, this distinction matters because early SEO data can be messy. A new Vietnam page may gain impressions but few clicks. English pages may attract regional managers while Vietnamese pages attract local users. Organic leads may look low in GA4 but become qualified later in the CRM.
Use this simple split:
| Work type | Main question | Output |
| SEO reporting | What changed? | Dashboard or monthly report |
| SEO data analysis | Why did it change? | Diagnosis and action plan |
| SEO performance measurement | Which KPIs matter? | Scoreboard and benchmark |
| SEO experimentation | Did our action cause the change? | Test result and decision |
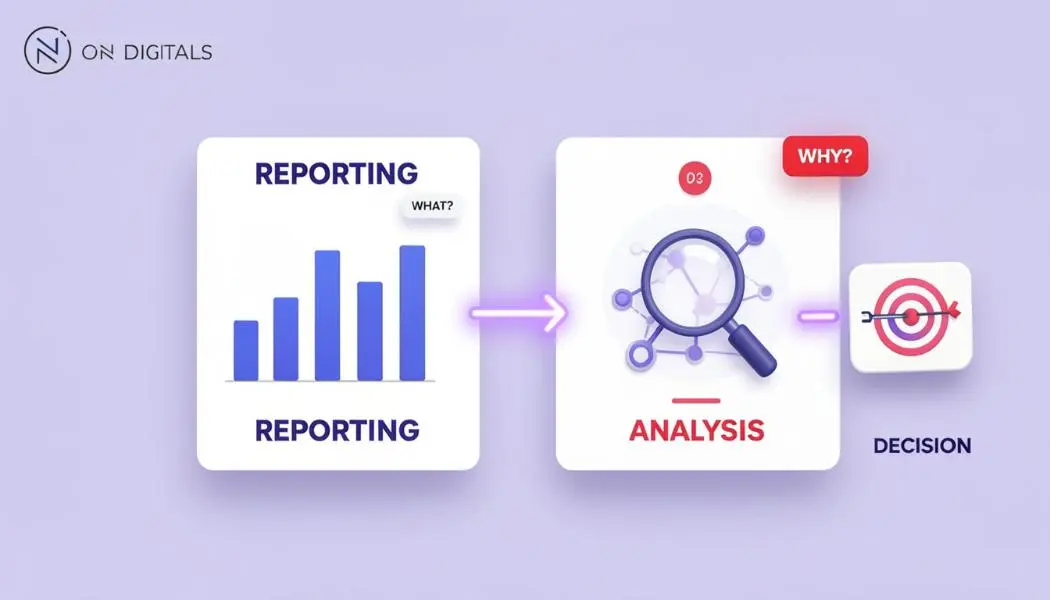 The core difference is that reporting tells you what happened, while analysis explains why it happened and provides actionable recommendations on what to do next.
Google Search Console’s Performance report gives the core search metrics: clicks, impressions, CTR, and average position. But Google also notes that search results can vary by time, place, device, and user context, so raw exports should not be treated as complete truth without segmentation.
Start by cleaning the data before drawing conclusions
Raw SEO data can mislead because Google Search Console, GA4, rank trackers, AI tools, and CRM systems measure different things. Before analysis, check privacy filtering, date ranges, sampling or thresholds, attribution windows, tracking changes, bot traffic, country filters, and whether the same landing page is measured consistently across tools.
Common data issues:
| Issue | Why it matters | QA step |
| GSC clicks ≠ GA4 sessions | Different measurement systems | Compare trends, not exact totals |
| Anonymized queries | Some low-volume queries are hidden | Use page-level and query-group analysis |
| Date range mismatch | SEO is seasonal | Use YoY and previous-period views |
| Tracking changes | GA4 events may change | Annotate implementation dates |
| Wrong country filter | Global data hides Vietnam signals | Segment by Vietnam and language |
| Bot or AI crawler traffic | Can inflate sessions | Filter suspicious sources and user agents |
| Branded query mix | Brand demand can hide SEO gains | Split branded vs non-branded queries |
Google states that some Search Console queries are anonymized to protect user privacy, and those queries are omitted from performance tables even though they may still be included in chart totals unless filters are applied.
For larger sites, Search Console Bulk Data Export can send daily Search Console performance data to BigQuery, with all available performance data except anonymized queries. This is useful when Google Sheets becomes too slow or when the team needs repeatable, long-term analysis.
A practical SEO data analysis workflow
A good SEO data analysis workflow should move from question to decision. Do not start by exporting every metric. Start with the business question, then collect only the data needed to answer it.
Step 1: Define the decision
Start with one decision the analysis should support. Examples:
| Business question | SEO analysis question |
| Should we invest in Vietnamese content? | Do Vietnamese queries already show impressions or conversions? |
| Did rankings drop because of an update? | Did impressions, position, and indexation change at the same time? |
| Is SEO producing qualified demand? | Which organic pages create CRM-qualified leads? |
| Is AI Search reducing clicks? | Are impressions rising while CTR and clicks stay flat on AI-heavy queries? |
| Which pages should be refreshed first? | Which pages have high impressions, falling CTR, or declining position? |
Step 2: Blend the right sources
Use the smallest reliable dataset first.
| Source | Best for | Limitation |
| Google Search Console | Queries, pages, impressions, clicks, CTR, position | Hidden queries, 16-month UI window, no direct conversion data |
| GA4 | Sessions, engagement, events, conversions | Organic source rules and attribution need QA |
| CRM | Lead quality and pipeline | Needs clean source/landing page fields |
| Rank tracker | Position monitoring | Does not show business value |
| BigQuery | Large-scale analysis | Needs setup and data skills |
| AI visibility tool/manual prompts | AI citations and brand mentions | Still directional, not stable like GSC |
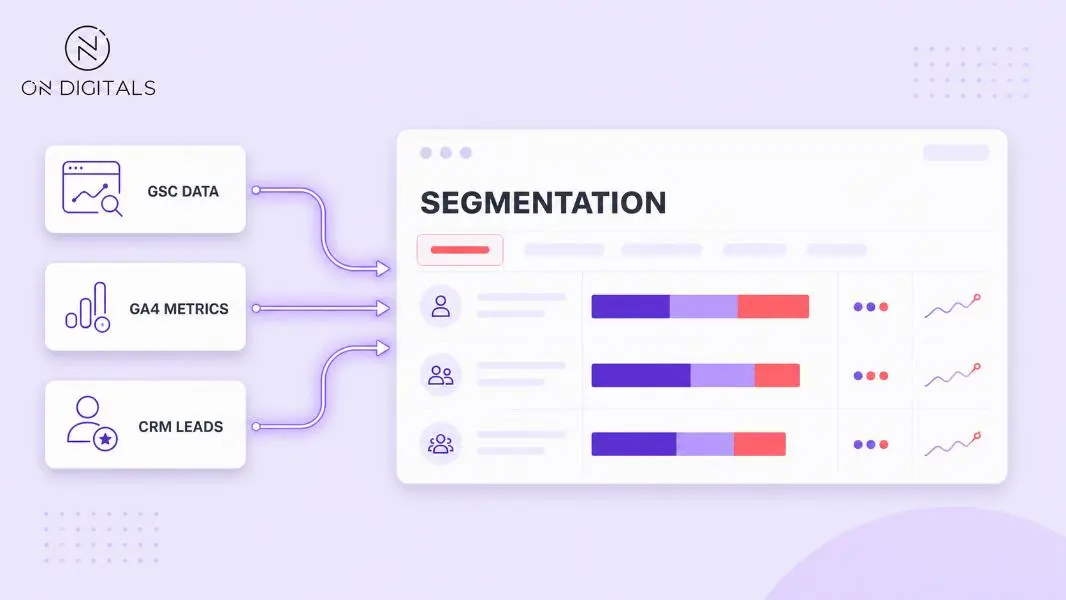 To conduct accurate SEO analysis, businesses need to combine and segment data from multiple sources, including Google Search Console, GA4, and CRM systems.
GA4 can export raw event data to BigQuery, allowing teams to query event-level data and join it with other business datasets.
Step 3: Segment before interpreting
Never analyze “organic traffic” as one block. Segment by market, language, page type, intent, device, brand/non-brand, and funnel stage.
For Vietnam market entry, start with these segments:
| Segment | Example |
| Market | Vietnam vs global |
| Language | English vs Vietnamese |
| Query type | Branded, non-branded, competitor, problem-led |
| Page type | Service, blog, product, category, case study |
| Intent | Informational, commercial, local, transactional |
| Device | Mobile vs desktop |
| Funnel stage | Awareness, consideration, conversion |
| AI exposure | Queries with AI Overview vs without, if tracked |
This is where Google Sheets becomes useful. Use QUERY() to aggregate exports and REGEXMATCH() to group queries by pattern. Google’s documentation says QUERY runs a Google Visualization API Query Language query across data, while REGEXMATCH tests whether text matches a regular expression.
Step 4: Find patterns and anomalies
Look for changes that are large enough, repeated enough, or commercially important enough to investigate. Good anomaly checks:
| Pattern | Possible meaning |
| Impressions down, position stable | Demand drop or seasonality |
| Impressions stable, CTR down | SERP layout, title/meta, AI Overview, ads |
| Position down, impressions down | Ranking loss or competitor gains |
| Clicks down, conversions stable | Low-value traffic lost |
| Sessions up, leads down | Intent mismatch or tracking issue |
| Organic leads up, SQLs down | Lead quality issue |
| Vietnamese pages indexed but no impressions | Poor query fit or weak internal links |
Do not react to one noisy day. Compare week-over-week, month-over-month, and year-over-year where possible.
Step 5: Diagnose the root cause
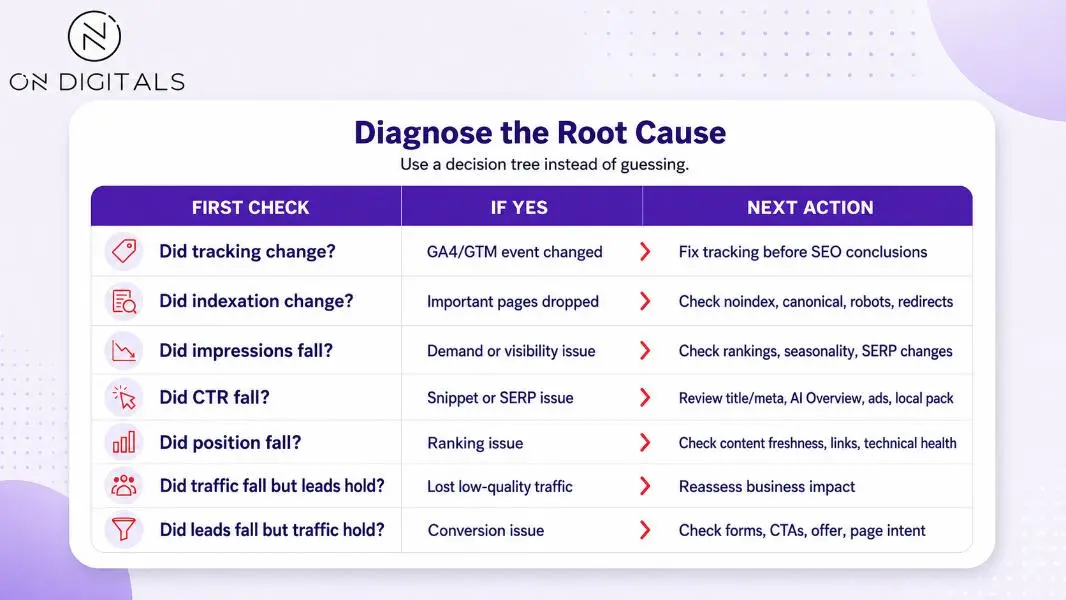 When traffic drops, use a structured process to identify the root cause.
Google has separate guidance for Search Console performance reports, data filtering, and BigQuery export, so use official definitions before assuming a tool is wrong.
Step 6: Separate correlation from causation
SEO performance should not be attributed to a single cause too quickly, as results are often shaped by both website changes and external factors, including competitor movements and changes in search behavior. Use this rule:
| Evidence level | What it supports |
| Correlation only | “This changed at the same time.” |
| Segmented correlation | “This changed for one page type, market, or query group.” |
| Pre/post with control | “Changed pages improved more than similar unchanged pages.” |
| SEO split test | “The change likely caused the lift.” |
| Business validation | “The change improved qualified demand or revenue.” |
For most market-entry SEO work, a practical pre/post comparison with a control group is enough. For large sites, use split testing or cohort-style analysis.
Google Sheets SEO data analysis setup
Google Sheets is useful for SEO data analysis because it is fast, collaborative, and flexible enough for query grouping, pivot tables, CTR analysis, content refresh prioritization, and simple market-entry dashboards. It is not a replacement for BigQuery, but it is often the best starting point for SMBs and regional marketing teams.
Suggested sheet tabs
| Tab | Purpose |
| GSC_raw | Exported query/page/date/country/device data |
| GA4_raw | Landing page, sessions, engagement, key events |
| CRM_raw | Lead status, source, landing page, country |
| Query_groups | Branded, non-branded, Vietnam, competitor, topic groups |
| Page_map | Page type, funnel stage, service line, language |
| Analysis | Pivots, formulas, diagnosis tables |
| Actions | Recommendation, owner, priority, expected impact |
| Change_log | Site updates, tracking changes, content refreshes, Google updates |
Useful Google Sheets formulas
| Formula | Use case |
| QUERY() | Aggregate clicks, impressions, CTR by page or query group |
| REGEXMATCH() | Classify queries by brand, topic, intent, or language |
| XLOOKUP() | Map landing pages to page type or service line |
| FILTER() | Pull pages matching a condition |
| SORT() | Prioritize pages by opportunity |
| Pivot tables | Compare page types, markets, or devices |
| Conditional formatting | Highlight drops, gains, or anomalies |
Example query grouping:
=IF(REGEXMATCH(LOWER(A2),”brand|brandname|on digitals”),”Branded”,”Non-branded”)
Example opportunity formula:
=IF(AND(Impressions>1000,CTR<0.02,Position<=10),”CTR opportunity”,”Review later”)
Use formulas as analysis support, not as final judgment. A low CTR may be caused by weak metadata, AI Overviews, ads, local packs, or an intent mismatch.
Google Sheets workflow: Finding SEO opportunities
A practical Google Sheets workflow should identify pages where SEO effort can create measurable improvement. The fastest wins often come from pages with high impressions, weak CTR, declining position, or strong traffic but low conversion.
Use this opportunity table:
| Pattern | Meaning | Action |
| High impressions, low CTR | Page is visible but not earning clicks | Rewrite title/meta, check SERP features |
| Position 8–20, high business value | Near page-one opportunity | Improve content depth and internal links |
| High traffic, low leads | Weak conversion path | Improve CTA, offer, form, proof |
| Strong English page, weak Vietnamese page | Localization gap | Create native Vietnamese version |
| Blog drives leads to service | Cluster opportunity | Add internal links and service CTA |
| Service page gets no impressions | Visibility gap | Build supporting content and links |
| Branded traffic up after PR | Awareness lift | Connect SEO with campaign reporting |
For businesses, add a Market column and a Language column. Without this, global organic performance can hide whether Vietnam SEO is actually moving.
How to analyze a traffic drop?
A traffic drop should be diagnosed in layers. Start with data quality, then indexation, then demand, then ranking, then CTR, then conversion. This prevents the team from rewriting content when the real problem is tracking, noindex tags, seasonality, or SERP layout.
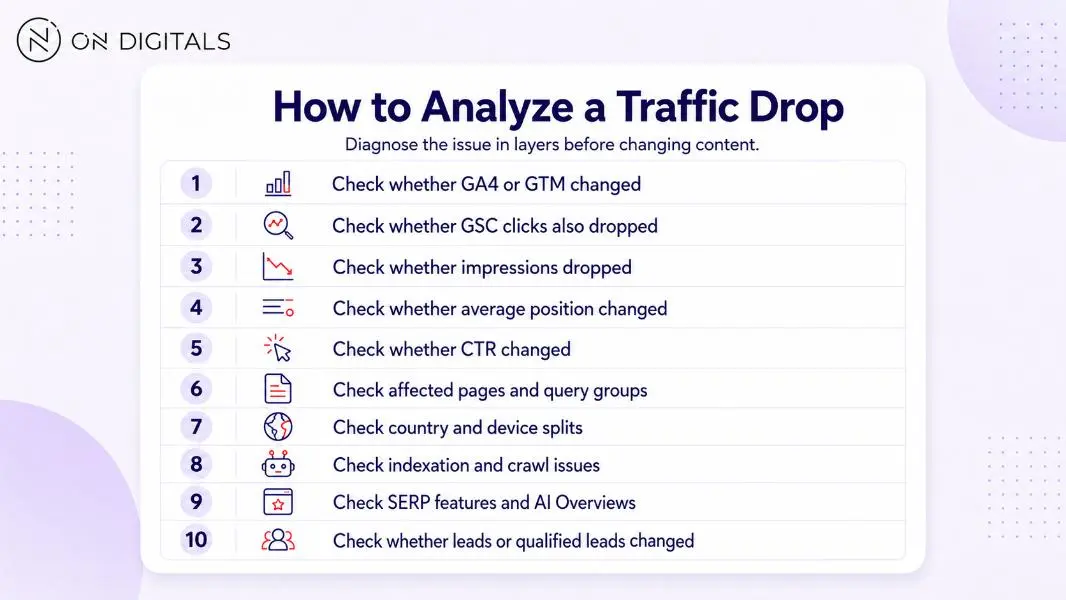 Traffic drops should be diagnosed step by step, from tracking to rankings, SERP changes, and lead impact.
Example diagnosis:
| Finding | Interpretation |
| GSC clicks down, impressions stable, CTR down | SERP or snippet issue |
| GSC clicks down, GA4 sessions stable | Tracking or attribution difference |
| Blog clicks down, service leads stable | Low commercial risk |
| Vietnam impressions down, global stable | Local market or language issue |
| Position stable, CTR down after AIO appears | AI/zero-click pressure |
Google says sites appearing in AI features such as AI Overviews and AI Mode are included in overall Search Console traffic, but there are no separate technical requirements for appearing in these features.
How to analyze SEO data in the AI Search era
AI Search changes SEO data analysis because visibility can increase while clicks stay flat or decline. Google’s generative AI Search guide says SEO remains relevant for AI features and explains query fan-out, where related searches are generated to build more complete AI responses.
For analysis, add three new layers:
| AI-era question | Data to collect |
| Are target queries triggering AI Overviews? | Manual SERP checks or AI visibility tools |
| Are we cited or mentioned? | AI Overview citations, ChatGPT/Perplexity/Gemini responses |
| Is AI changing click behavior? | GSC impressions, CTR, clicks, ranking, SERP notes |
Ahrefs re-ran its AI Overview click study using December 2025 data and found that AI Overview presence correlated with a 58% lower average click-through rate for the top-ranking page. Treat this as a study-specific correlation, not a guaranteed outcome for every keyword or market.
In Google Sheets, add columns such as:
| Column | Values |
| AIO_present | Yes/ No |
| AIO_cited_our_site | Yes/ No |
| AIO_cited_competitor | Competitor domain |
| AI_answer_angle | Definition, list, comparison, recommendation |
| SERP_note | Ads, local pack, video, shopping, forum |
| Likely_click_pressure | Low, medium, high |
This lets the team explain why ranking and traffic no longer move together.
How to connect SEO analysis with revenue?
SEO data analysis is most useful when it links search behavior to lead quality and business impact. For companies expanding into Vietnam, integrating SEO and CRM data can provide a clearer view of what drives meaningful growth.
Use this join logic:
| SEO data | CRM data | Decision |
| Landing page | Lead source page | Which pages create qualified leads? |
| Query group | Lead topic | Which search themes attract useful demand? |
| Market/country | Lead country | Is Vietnam’s demand real? |
| Page type | Lead quality | Do blogs or service pages produce better leads? |
| Campaign date | Pipeline date | Did market-entry campaigns lift branded search? |
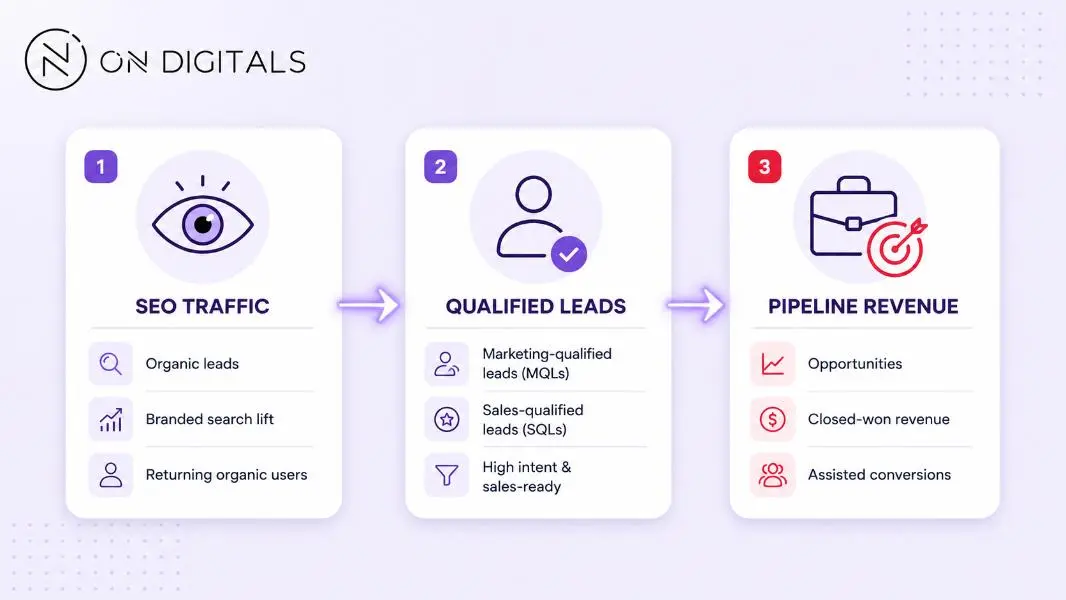 SEO analysis creates more business value when it connects organic traffic, qualified leads and pipeline revenue.
Do not judge SEO only by last-click conversions. Many foreign businesses entering Vietnam need multiple search, social, paid, PR, and sales touchpoints before a buyer contacts the team.
Common SEO data analysis mistakes
Most SEO analysis mistakes come from trusting raw data too quickly or reacting to noise. A good analyst checks definitions, segments, and business impact before recommending changes.
| Mistake | Why it fails | Better approach |
| Comparing GSC clicks to GA4 sessions exactly | Different systems count differently | Compare trends and diagnose gaps |
| Looking only at total organic traffic | Hides market and intent differences | Segment by country, language, query type |
| Ignoring anonymized queries | Understates long-tail demand | Analyze page and topic groups too |
| Reacting to one-day drops | SEO data is noisy | Use weekly/monthly views |
| Treating CTR drop as metadata issue only | SERP features may reduce clicks | Check AI, ads, local pack, snippets |
| Calling correlation causation | Many things change together | Use control groups or tests |
| Ignoring CRM quality | Traffic can be irrelevant | Track qualified leads |
| Forgetting change logs | No way to explain movement | Maintain a changelog |
The uploaded competitor insight specifically flags correlation vs causation, SEO testing, data traps, and lack of hands-on analysis as gaps to exploit.
A 30-day SEO data analysis sprint
A 30-day sprint gives foreign businesses a practical way to turn messy SEO data into a decision-ready roadmap for Vietnam.
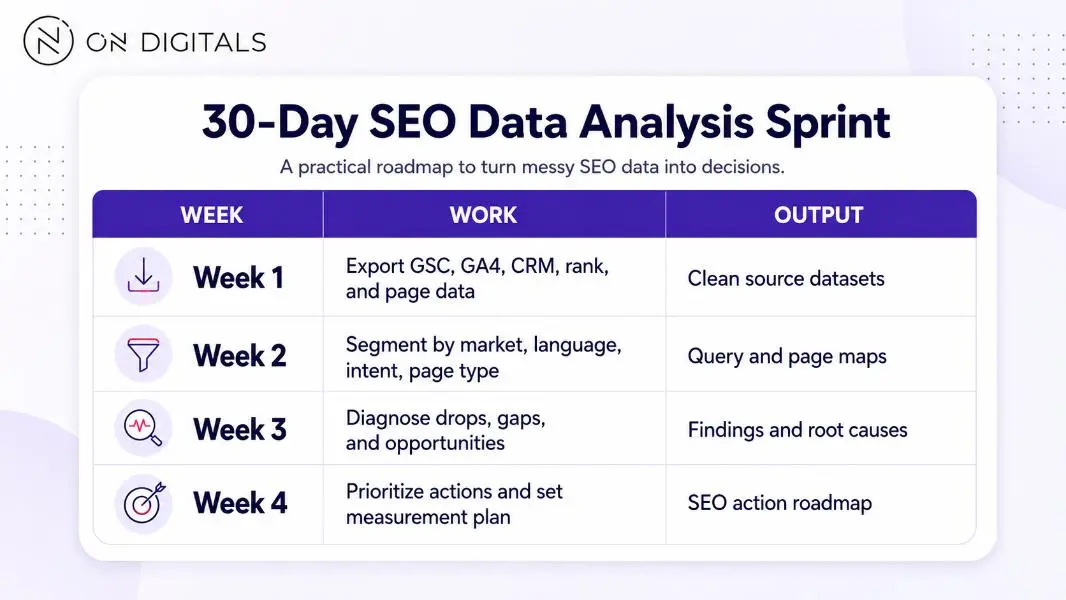 A 30-day sprint transforms messy SEO data into a focused action plan for the next month.
Priority actions should include expected impact, effort, owner, deadline, and measurement method. Example action table:
| Finding | Action | Owner | KPI |
| High impressions, low CTR on Vietnam service page | Rewrite title/meta and intro | SEO/content | CTR, clicks |
| English guide has Vietnam impressions | Create Vietnamese version | Content | VI impressions, leads |
| Blog assists service leads | Add internal links and CTA | SEO | Service page clicks |
| AI Overview cites competitor | Add source-backed direct answer | SEO/content | AI citation check |
| Organic leads low quality | Adjust page CTA and form fields | CRO/CRM | SQL rate |
FAQs
What is SEO data analysis?
SEO data analysis is the process of cleaning, segmenting, and interpreting organic search data to understand why performance changed and what action should follow. It uses sources such as Google Search Console, GA4, Google Sheets, BigQuery, CRM data, rank trackers, and AI visibility checks.
How do I do SEO data analysis in Google Sheets?
Export Search Console and GA4 data, map pages by type, group queries with formulas such as REGEXMATCH, summarize trends with QUERY or pivot tables, then compare impressions, clicks, CTR, position, sessions, events, and leads by market, language, and intent. Use findings to prioritize actions, not just build a report.
Why do GSC clicks and GA4 sessions not match?
GSC and GA4 use different collection methods and definitions. GSC measures clicks from Google Search results, while GA4 measures website sessions and events after the page loads. Tracking blockers, attribution rules, redirects, consent settings, and page-load issues can create differences.
What is the best free stack for SEO data analysis?
A strong free stack starts with Google Search Console, GA4, Google Sheets, Looker Studio, PageSpeed Insights, and manual SERP checks. Larger or more technical teams can add Search Console Bulk Data Export and GA4 BigQuery Export for deeper query, page, event, and conversion analysis.
How should SEO data analysis change for AI Search?
SEO data analysis should track AI Overview presence, citations, brand mentions, prompt coverage, and query groups where impressions rise but CTR or clicks fall. Google Search Console does not give a separate AI Overview report, so combine GSC trends with manual SERP checks or AI visibility tools.
How often should SEO data analysis be done?
Run light SEO analysis weekly for technical or tracking issues, monthly for traffic and content decisions, and quarterly for roadmap changes. For foreign businesses entering Vietnam, quarterly analysis should separate English and Vietnamese content, Vietnam users, branded search, CRM lead quality, and AI Search visibility.
Final takeaway
SEO data analysis is the work between reporting and action. It cleans imperfect data, segments it by market and intent, finds the cause behind changes, and turns that cause into a decision.
For foreign businesses entering Vietnam, the strongest approach is vendor-neutral and practical: use Search Console, GA4, Google Sheets, BigQuery when needed, CRM data, and AI visibility checks to understand what search is actually doing for qualified demand.

NEWEST POSTS
- Advertising Industry In Vietnam: The 2026 Trends, Channels and Market-Entry Strategy
- Best SEO Company in Vietnam: Latest Shortlist For Businesses
- How To Leverage Social Media For Customer Service Like A Pro?
- Social Media Post Tips – 8 Ways To Boost Engagement
- How To Use Social Media for Sales – In-depth Beginner Guide
Read more