
What Is a Metric in Google Analytics? GA4 Metrics Explained
Vincent
01/06/2024
43
A metric in Google Analytics 4 is a numerical measurement that shows activity or results on a website or app. Metrics can tell you how many people visited, how often an action happened, or whether users completed an important step. When combined with dimensions such as channel, device or landing page, metrics help turn GA4 data into useful decisions.
SEO platforms like Google Analytics 4 can look complicated at first because every report contains many numbers. The key is to understand what each number measures and why it matters. A metric is not automatically a sign of success, and more traffic does not always mean better performance.
What is a metric in Google Analytics? The quick answer
A metric in Google Analytics is a number that measures website or app activity. It can be a total, an average, a ratio or a percentage.
For example, “Sessions” is a metric because it shows the number of visits. “Event count” is a metric because it shows how many times users triggered an action.
Metrics answer questions such as:
|
Question |
Metric to review |
|
How many people visited the website? |
Active users |
|
How many visits did the website receive? |
Sessions |
|
How many times was a page viewed? |
Views |
|
How often did users take an action? |
Event count |
|
How many important actions happened? |
Key events |
Metrics are always numerical. A page title, city or traffic source is not a metric. Those are dimensions, which give context to the numbers.
For example, “500 sessions” is useful, but it is still incomplete. You may also want to know whether those sessions came from Organic Search, paid ads or social media.
Metric vs dimension in Google Analytics
A metric tells you how many or how much. A dimension tells you what, where, when or which group the metric belongs to.
This distinction is one of the most important parts of reading GA4 reports.
|
Question |
Metric |
Dimension |
|
How many sessions came from organic search? |
Sessions |
Session default channel group |
|
Which landing page received the most views? |
Views |
Landing page |
|
Which device produced more key events? |
Key events |
Device category |
|
Which city had the strongest engagement? |
Engagement rate |
City |
Think of a metric as the number in a report. Think of a dimension as the label that explains the number.
For example:
- “1,000 sessions” is a metric.
- “Organic Search” is a dimension.
- “1,000 sessions from Organic Search” is a useful insight.
Looking at metrics without dimensions can lead to weak conclusions. A website may have more sessions overall, but the increase may come from a channel that rarely generates leads. Dimensions help you see where the number comes from.
This is why GA4 reports often place dimensions in the first column and metrics in the next columns.
How GA4 turns user actions into metrics
Google Analytics 4 uses an event-based measurement model. This means GA4 records actions that happen on a website or app, then turns those actions into reportable data.
The process is simple: a user does something, GA4 records the action as an event, and reports use metrics to show how often it happened.
Users take actions on the website
A visitor may read a page, scroll through an article or click a button. They may also download a file, submit a form or make a purchase.
These actions show how people interact with your website. Some are basic actions. Others may be closely linked to business goals.
For example, reading a blog post may show early interest. Submitting a consultation form may show stronger intent.
GA4 records actions as events
An event is a recorded interaction or occurrence. GA4 can collect some events automatically. Businesses can also configure events that are more relevant to their website.
A simple lead-generation website may track events such as:
|
User action |
Possible GA4 event |
|
Page loads |
page_view |
|
User scrolls through a page |
scroll |
|
User clicks a contact button |
contact_click |
|
User submits a form |
form_submit |
|
User downloads a brochure |
file_download |
The event name describes the action. The event count shows how many times that action occurred.
Reports turn events into metrics
GA4 reports use events to create metrics. These metrics help you understand traffic, engagement and outcomes.
|
Event or activity |
Example metric |
|
Page views |
Views |
|
Form submissions |
Event count |
|
Important form submissions |
Key events |
|
Product purchases |
Purchases or revenue |
|
User engagement |
Engagement rate |
This structure gives businesses more flexibility than older analytics models. You can track actions that matter to your website instead of relying only on page views.
The most useful GA4 metrics for beginners
You do not need to track every metric in GA4. Start with a small group that helps answer real business questions.
The most useful metrics usually fall into three categories: traffic, engagement and outcomes.
Traffic metrics: Are people reaching the website?
Traffic metrics show whether people are arriving on your website. They are useful for understanding overall visibility and channel activity.
|
Metric |
What it means |
Use it when |
|
Active users |
Users who had an engaged session |
Check active audience size |
|
Sessions |
Visits that started on the site or app |
Compare channel activity |
|
Views |
Total page and screen views |
Identify popular content |
|
New users |
First-time users during the selected period |
Review audience growth |
Sessions and users are related, but they are not the same. One person can visit a website more than once. That may create several sessions while still representing one user.
Traffic metrics are a starting point. They show whether people arrive, but they do not prove that the visit was valuable. For a full SEO view, traffic data should be reviewed alongside Google Search visibility.
Engagement metrics: Are visitors interacting with content?
Engagement metrics show whether users interact meaningfully with the website after they arrive.
|
Metric |
What it means |
Use it when |
|
Engaged sessions |
Sessions that meet GA4 engagement conditions |
Review content quality |
|
Engagement rate |
Share of sessions that were engaged |
Compare landing pages |
|
Average engagement time |
Time users actively spent with your site |
Review content interest |
|
Event count |
Total number of recorded actions |
Track interaction volume |
An engaged session is not simply a long visit. GA4 considers a session engaged when it meets conditions such as lasting longer than 10 seconds, creating a key event or viewing multiple pages or screens.
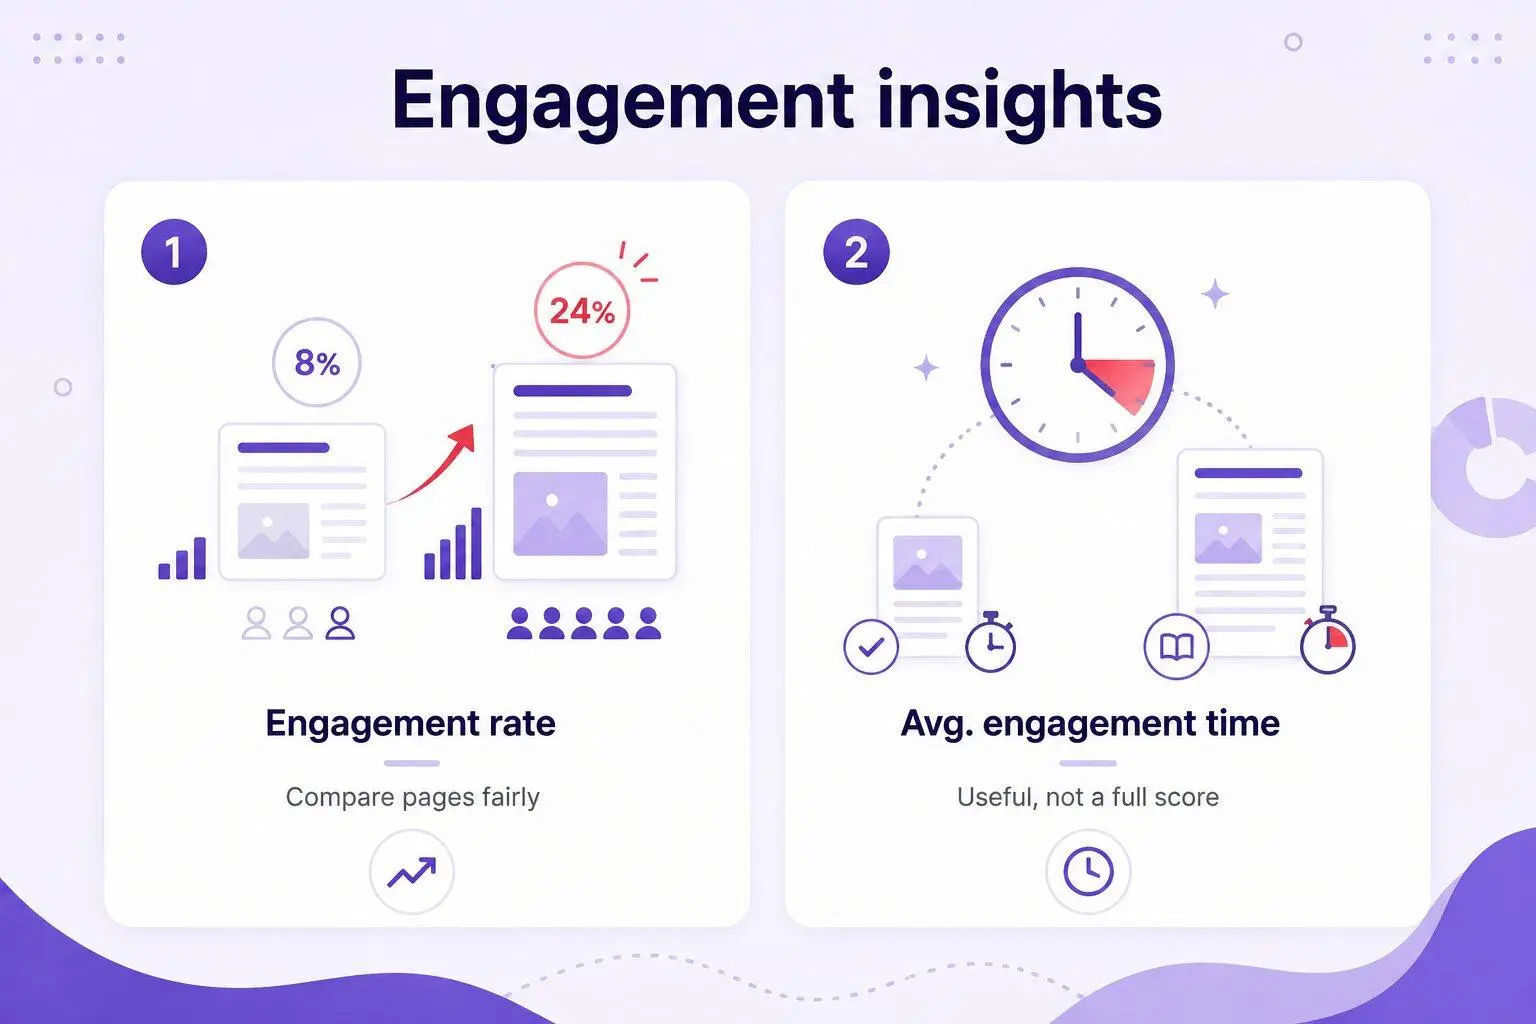
Engagement rate can help compare pages with different traffic levels. A page with fewer visitors may still be more useful if a higher share of visitors engages with it.
Average engagement time is also useful, but it should not be treated as a complete quality score. A short page may serve its purpose quickly. A long guide may naturally take longer to read.
Outcome metrics: Does the website support business goals?
Outcome metrics show whether users complete actions that matter to the business.
|
Metric |
What it means |
Use it when |
|
Key events |
Important actions marked by the business |
Measure leads or purchases |
|
Session key event rate |
Share of sessions that produced a key event |
Compare channel quality |
|
Purchases |
Completed ecommerce transactions |
Review sales activity |
|
Total revenue |
Revenue from tracked ecommerce activity |
Review revenue contribution |
A key event is an event that matters to your business. For an ecommerce site, it may be a purchase. For a B2B company, it may be a qualified form submission.
Not every event should become a key event. A simple button click may show interest, but it may not represent a meaningful business outcome.
The right outcome metric depends on your website. A clinic may focus on booking requests. A software company may focus on demo enquiries. An ecommerce brand may focus on purchases and revenue.
Metric vs KPI: Why not every metric should be a goal
Every KPI is a metric, but not every metric is a KPI.
A metric is any number that GA4 measures. A KPI, or key performance indicator, is a metric selected because it directly supports a business objective.
For example, event count is a metric. It becomes more important when the event represents a valuable action.
|
Business objective |
Possible KPI |
Supporting metrics |
|
Generate qualified enquiries |
Qualified form submissions |
Sessions, CTA clicks |
|
Improve ecommerce sales |
Purchases or revenue |
Product views, add-to-cart events |
|
Grow content performance |
Organic engaged sessions |
Views, scroll events |
|
Improve landing page quality |
Session key event rate |
Engagement rate, average engagement time |
A KPI should help a team make decisions. If the number changes, the team should know what to investigate next.
For example, a drop in organic sessions may need a visibility review. A drop in form submissions may require checking the landing page, CTA or tracking setup.
The best KPI is not always the biggest number. It is the number that reflects progress toward a useful outcome.
For broader guidance on choosing SEO KPIs, see our guide to SEO performance metrics.
How to use metrics with dimensions to answer real questions
Metrics become more useful when you segment them with dimensions. This helps move from “What happened?” to “Where did it happen, and why?”
Which channel brings high-quality traffic?
To answer this question, review a conversion-related metric and group it by channel.
|
Metric |
Dimension |
|
Key events |
Session default channel group |
|
Session key event rate |
Session default channel group |
This can show whether Organic Search, Paid Search, Referral or Email brings visitors who take meaningful action.
High traffic alone is not enough. A channel with fewer sessions may still be more valuable if it produces more qualified enquiries.
Which landing pages need improvement?
Landing pages are the first pages users see after arriving. A landing page with traffic but weak engagement may need clearer content or a stronger CTA.
|
Metric |
Dimension |
|
Engagement rate |
Landing page |
|
Key events |
Landing page |
|
Session key event rate |
Landing page |
For example, a service page may receive many sessions but few form submissions. The issue could be page relevance, offer clarity or user experience.
Which device has a conversion problem?
Mobile and desktop users may behave differently. A form that works well on desktop may feel difficult to complete on a phone.
|
Metric |
Dimension |
|
Key events |
Device category |
|
Engagement rate |
Device category |
|
Average engagement time |
Device category |
This comparison can help identify practical issues. A large gap may suggest that the mobile layout, page speed or form experience needs review.
Which content encourages interaction?
Content performance should not be judged only by views. A useful page may also encourage people to read more, download a resource or explore related services.
|
Metric |
Dimension |
|
Event count |
Page title or page path |
|
Key events |
Landing page |
|
Engagement rate |
Page title or page path |
This is especially useful for blogs and resource hubs. It can show which topics attract interest and which pages support deeper journeys.
GA4 metrics that replaced common Universal Analytics terms
Google Analytics 4 uses a different measurement model from Universal Analytics. Many older terms no longer apply in the same way.
|
Universal Analytics term |
GA4 term or approach |
What changed |
|
Pageviews |
Views |
Includes web page and app screen views |
|
Unique Pageviews |
No direct equivalent |
Do not use as a GA4 reporting metric |
|
Average Session Duration |
Average engagement time |
Focuses on active engagement |
|
Goals |
Key events |
Mark important events as key events |
|
Views |
Data streams |
GA4 uses web and app data streams |
|
Total Users |
Active users often appears by default |
Report context can affect the user metric shown |
This does not mean GA4 metrics are harder. It means reports need to be read with GA4 definitions in mind.
For example, engagement rate is not the same as a simple page-quality score. It measures the share of sessions that GA4 considers engaged. Using old definitions can create confusion. When building a dashboard, make sure everyone on the team uses the same GA4 terminology.
How to choose the right GA4 metrics for your website
Start with the business action you want users to complete. Then decide how that action should be tracked.
A simple process looks like this:
- Define one business objective.
- Identify the user action that supports it.
- Track that action as an event.
- Mark meaningful actions as key events.
- Review performance by useful dimensions.
- Compare results over time.
For example, a B2B business may want more qualified enquiries.
|
Step |
Example |
|
Business objective |
Generate qualified enquiries |
|
User action |
Submit a contact form |
|
Event |
form_submit |
|
Key event |
Qualified form submission |
|
Main metric |
Key events |
|
Useful dimension |
Landing page or channel group |
This approach keeps reporting focused. It prevents teams from tracking numbers that do not support a decision. GA4 can collect many metrics, but your report should focus on the few that help answer your most important questions.
Common mistakes when reading Google Analytics metrics
The first mistake is treating every metric as equally important. A report may contain dozens of numbers, but only a few may relate to the current business goal.
Another mistake is looking only at totals. A total session count does not explain whether the traffic came from the right source, landed on the right page or completed a useful action.
Common issues include:
- Tracking page views but not meaningful events
- Using traffic growth as proof of success
- Ignoring dimensions such as channel or landing page
- Using older Universal Analytics definitions
- Comparing short date ranges without context
- Building dashboards before defining goals
GA4 reports should support decisions, not create more numbers to review.
When a metric changes, ask what else changed. A new campaign, seasonal demand, website redesign or tracking update can all affect the data.
Frequently Asked Questions (FAQs)
What is a metric in Google Analytics?
A metric in Google Analytics is a numerical measurement. It shows how many times something happened, how much activity occurred or what percentage of users completed an action. Sessions, views, event count and engagement rate are all examples of metrics.
What is the difference between a metric and a dimension in GA4?
A metric is a number, such as sessions or key events. A dimension describes the context behind the number, such as traffic source, city, device category or landing page. Metrics show the amount. Dimensions explain where the amount came from.
Is a session a metric or a dimension?
A session is a metric. It measures the number of visits that started on a website or app. You can analyse sessions by dimensions such as channel group, device category, country or landing page.
What are the most important GA4 metrics for a website?
The most important GA4 metrics depend on the website goal. Most websites start with traffic metrics, engagement metrics and key event metrics. A lead-generation website may prioritise form submissions. An ecommerce website may prioritise purchases and revenue.
What is the difference between a metric and a KPI?
A metric is any measurable number. A KPI is a metric chosen because it reflects progress toward a business goal. For example, event count is a metric. Qualified form submissions may become a KPI for a B2B company.
Why does GA4 show Active Users instead of Users?
GA4 often uses Active Users as a default user metric because it focuses on people who had an engaged session. This can differ from older analytics reports that used Total Users more often.
What replaced Goals in Google Analytics 4?
GA4 uses key events instead of Goals. A business can mark an event as a key event when it represents an action that matters, such as a form submission, booking request or purchase.
Does Google Search Console use the same metrics as GA4?
No. Google Search Console and GA4 measure different stages of the user journey. Search Console focuses on Google Search visibility. GA4 focuses on what users do after they reach the website.
Final thoughts
Google Analytics metrics turn website activity into measurable numbers. However, a number is useful only when it is connected to the right business question. The most practical GA4 reports combine metrics with dimensions. They show not only what happened, but also where the result came from.

NEWEST POSTS
- Advertising Industry In Vietnam: The 2026 Trends, Channels and Market-Entry Strategy
- Best SEO Company in Vietnam: Latest Shortlist For Businesses
- How To Leverage Social Media For Customer Service Like A Pro?
- Social Media Post Tips – 8 Ways To Boost Engagement
- How To Use Social Media for Sales – In-depth Beginner Guide
Read more