
Insights
Core Web Vitals Tools: How to Test, Monitor, and Improve Page Performance
On Digitals
16/01/2026
15
Website speed today goes far beyond simple load times. Core Web Vitals tools are now essential for businesses that want to protect search visibility and deliver strong user experiences, as Google directly uses page experience signals as a ranking factor. The challenge is knowing which Core Web Vitals checker solutions provide actionable insights instead of surface-level metrics.
This guide highlights the right tools, explains field data versus lab data, and shows how to turn Core Web Vitals measurements into practical improvements that support both SEO performance and long-term growth.
What are Core Web Vitals and why they matter for SEO
Core Web Vitals are Google’s standardized metrics for measuring real user experience, focusing on loading speed, interactivity, and visual stability rather than purely technical benchmarks. By narrowing performance down to three meaningful indicators, Core Web Vitals reflect how visitors actually experience a website.
Sites that load fast, respond smoothly, and maintain stable layouts keep users engaged longer, drive higher conversions, and are more likely to be rewarded with stronger search rankings.
How the “Page Experience” signal impacts rankings
Google introduced Page Experience as a ranking factor in 2021, fundamentally changing how search algorithms evaluate website quality. This system combines Core Web Vitals with other user experience signals like mobile-friendliness, HTTPS security, and the absence of intrusive interstitials to create a comprehensive quality score. While content relevance remains the primary ranking factor, Page Experience acts as a tiebreaker when multiple pages offer similar informational value.
The ranking impact works through a threshold system rather than a linear scale. Sites meeting “Good” thresholds across all three Core Web Vitals metrics gain a ranking advantage over competitors stuck in “Needs Improvement” or “Poor” categories. This means you don’t need perfect scores to benefit, but falling below minimum standards puts you at a measurable disadvantage.

Page Experience rewards sites that meet Core Web Vitals standards
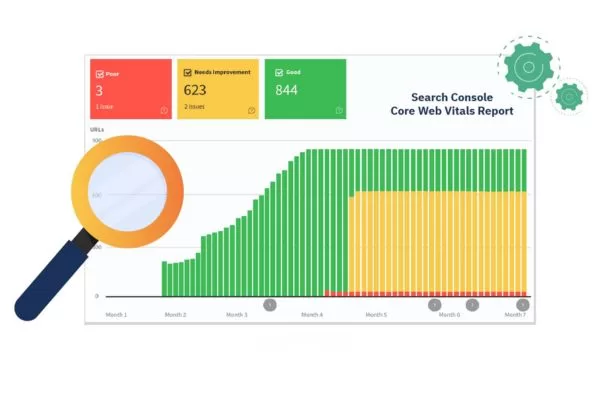
Search Console data shows that pages passing Core Web Vitals assessments maintain stronger organic visibility during algorithm updates. Google’s crawlers may also prioritize well-performing pages, leading to faster indexing of new content and more frequent cache refreshes. The connection between technical performance and SEO visibility has never been more direct.
The direct business impact of web performance
Performance metrics translate directly into business outcomes in ways that surprise many site owners. Amazon famously found that every 100ms of additional latency cost them 1% in sales, while Google discovered that an extra half-second in search page generation dropped traffic by 20%. These patterns repeat across industries and business models.
Conversion rate optimization studies consistently show that faster sites convert better. An ecommerce site improving its Largest Contentful Paint from 4 seconds to 2 seconds might see a 15-20% increase in completed purchases. B2B lead generation sites experience similar lifts in form completions when responsiveness metrics (like INP) improves. The correlation between Core Web Vitals performance and revenue metrics proves impossible to ignore.
Web performance directly impacts conversions, revenue, and customer retention
Beyond direct conversions, page experience affects customer lifetime value through reduced bounce rates and increased engagement. Users who experience fast, stable interactions develop stronger brand trust and return more frequently. Mobile users particularly reward good performance, with studies showing that 53% of mobile visitors abandon sites taking longer than 3 seconds to load. Your Core Web Vitals assessment results literally predict how many potential customers you’re losing before they even see your value proposition.
Deep dive: The three Core Web Vitals metrics explained
Understanding what each Core Web Vital actually measures helps you diagnose issues and prioritize fixes effectively. These metrics aren’t arbitrary numbers but carefully chosen indicators that reflect specific aspects of user experience. Let’s break down exactly what Google evaluates and why each metric matters for both SEO performance and business results.
Largest Contentful Paint (LCP)
Largest Contentful Paint measures how quickly the main content element becomes visible to users. This metric identifies the largest image, text block, or video thumbnail within the viewport and tracks when it finishes rendering. Google considers under 2.5 seconds “Good,” 2.5-4 seconds “Needs Improvement,” and over 4 seconds “Poor.”
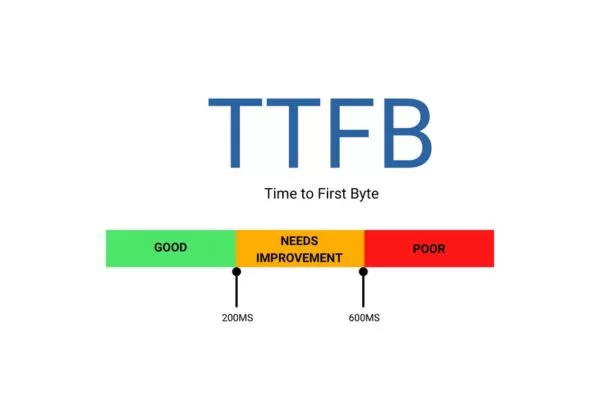
Most LCP issues stem from slow server response times (Time to First Byte – TTFB), render-blocking resources, or unoptimized images. The hero image on your homepage, the featured product photo on category pages, or the banner on blog posts typically becomes your LCP element. Identifying which element triggers the measurement requires using Core Web Vitals tools that highlight the specific DOM element responsible.
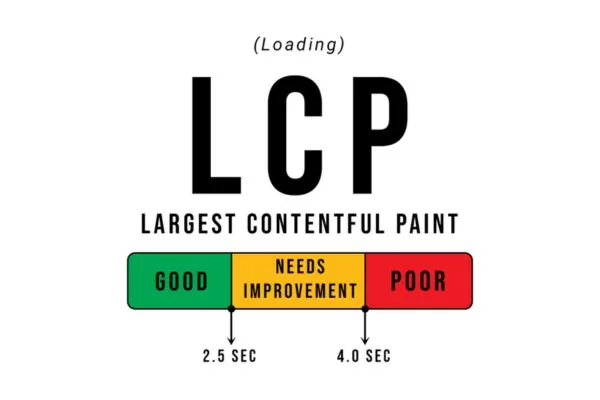
LCP measures how fast the main page content appears to users
Think of LCP as the moment visitors feel your page has actually loaded. Even if other elements continue rendering, users form their first impression based on when meaningful content appears. A fast LCP creates immediate confidence that your site works properly, while slow LCP triggers impatience and increases abandonment likelihood. This explains why LCP correlates so strongly with bounce rates and engagement metrics.
Interaction to Next Paint (INP)
Interaction to Next Paint replaced First Input Delay in March 2024 as Google’s primary responsiveness metric. INP measures the latency between user interactions and visible feedback across the entire page lifecycle, not just the first click. This provides a more comprehensive picture of how responsive your site feels during actual use.
Google defines good INP performance as under 200ms, with 200-500ms needing improvement and over 500ms considered poor. The metric captures clicks, taps, and keyboard inputs, then measures how long before the browser paints the next frame to provide visual feedback. Heavy JavaScript execution, large DOM sizes, and inefficient event handlers typically cause INP problems.
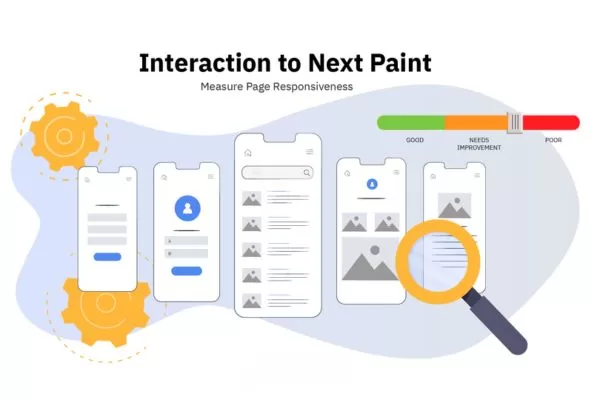
INP measures how quickly your site responds to user interactions
Responsiveness matters because users expect immediate feedback confirming their actions registered. When someone clicks a button and nothing happens for half a second, they often click again, potentially triggering duplicate submissions or erratic behavior. Good INP scores create a sense of control and snappiness that keeps users engaged. This metric particularly affects ecommerce checkout flows, form submissions, and interactive features where every millisecond of perceived delay increases abandonment risk.
Cumulative Layout Shift (CLS)
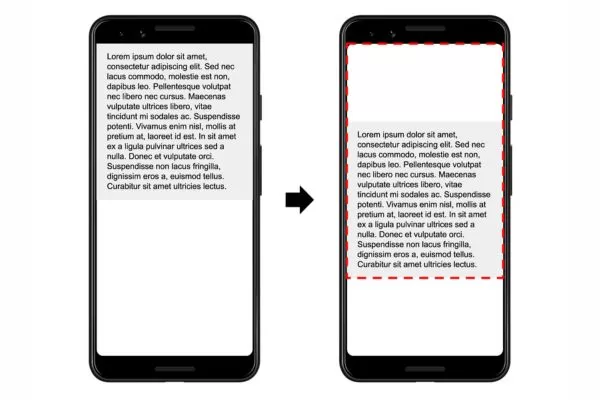
Cumulative Layout Shift quantifies visual stability by measuring unexpected movement of page elements during loading. CLS adds up all individual layout shift scores occurring during the page’s lifetime, with scores under 0.1 considered good, 0.1-0.25 needing improvement, and over 0.25 marked as poor.
Layout shifts happen when images load without defined dimensions, fonts swap after initial render (Flash of Unstyled Text – FOUT), or dynamically injected content pushes existing elements around. That frustrating experience of clicking a link only to accidentally tap an ad that just appeared? That’s a CLS problem causing real user frustration and potential revenue loss.

CLS measures visual stability by tracking unexpected layout shifts
Visual stability affects user trust in subtle but powerful ways. Sites with significant layout shifts feel buggy and unprofessional, even if everything technically works. Users second-guess their actions, hesitate before clicking, and develop negative brand associations. For content sites, CLS interferes with reading flow. For ecommerce, it creates checkout friction. Measuring CLS with proper Core Web Vitals test tool options helps identify which elements cause instability so you can fix them systematically.
Field data vs. lab data: Understanding performance measurement
The difference between field and lab data is a key concept in performance monitoring. When results from a google Core Web Vitals checker don’t match local tests, understanding how each data type works helps you interpret metrics correctly and set realistic optimization goals.
Real User Monitoring with field data
Field data captures actual performance experienced by real visitors using the Chrome browser. Google collects this through the Chrome User Experience Report (CrUX), which aggregates anonymous measurements from millions of users worldwide. This data reflects genuine conditions including diverse devices, network speeds, geographic locations, and browsing contexts.
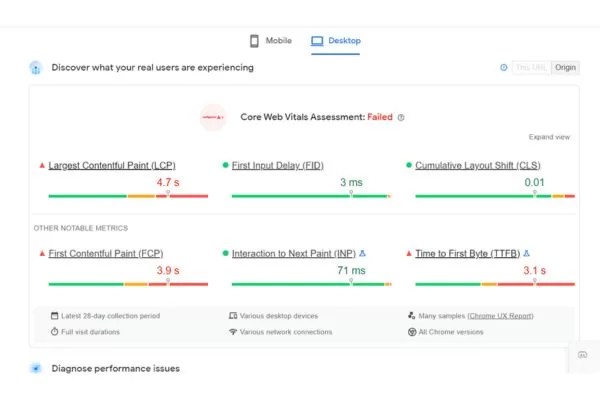
When you run a Core Web Vitals check in Search Console or PageSpeed Insights, the field data section shows CrUX results for your specific URL or origin-level data if the URL has insufficient traffic. Google categorizes performance into “Good,” “Needs Improvement,” and “Poor” based on the 75th percentile of real user experiences. This means if the 75th percentile value meets the “Good” threshold, the page passes that specific metric assessment.
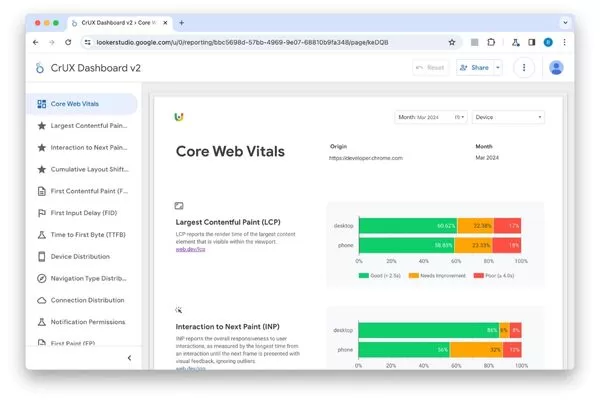
Field data shows real Core Web Vitals performance from actual users
Field data provides irreplaceable insight into how your site performs in the wild. Lab tests might show perfect scores on your high-end development machine with fast wifi, but field data reveals that mobile users on 4G connections struggle with your site. This reality check prevents optimization efforts from missing the problems actual visitors face. The challenge comes from CrUX requiring significant traffic volume before reporting data, leaving low-traffic pages without field measurements.
Synthetic testing with lab data
Lab data comes from simulated tests in controlled environments using tools like Lighthouse. These tests run on standardized hardware and network conditions, providing consistent, reproducible results perfect for debugging and development workflows. Lab tests catch issues before deployment and help track the impact of specific code changes.
The controlled nature of lab testing offers both advantages and limitations. You can test unpublished pages, compare different implementations, and identify specific technical bottlenecks using diagnostic tools like the main-thread activity trace. However, lab results don’t account for real-world variability. Your Lighthouse score might hit 100/100 on a desktop workstation while actual mobile users experience poor performance due to slower processors and network conditions.

Lab data uses simulated tests to diagnose performance issues before launch
Smart performance strategies use lab data for development and quality assurance, then validate with field data once pages go live. Tools that combine both measurement types, like PageSpeed Insights, help bridge this gap by showing how your controlled test results compare to real user experiences. Understanding both perspectives gives you complete visibility into site performance.
Why the 28-day reporting window matters
Field data updates based on a rolling 28-day collection period, meaning changes to your site take time to reflect in CrUX reports. This delay frustrates site owners who implement fixes and expect immediate validation. Understanding this timeline helps set realistic expectations and prevents premature conclusions about optimization efforts.
The 28-day window serves an important purpose: statistical significance. Performance measurements vary naturally based on traffic patterns, seasonal effects, and external factors. Averaging across four weeks smooths out these fluctuations to reveal genuine performance trends rather than temporary anomalies. A single day of server issues won’t immediately tank your entire Core Web Vitals assessment status.

Field data reflects Core Web Vitals changes over a 28-day rolling window
This reporting lag means your optimization strategy needs patience. After implementing improvements, continue monitoring lab data for immediate feedback while waiting for field data to catch up. Most significant optimizations show measurable field data improvements within a few days as the “slow” data from the previous period is replaced, with full impact visible by the 4-week mark. Document your changes with timestamps so you can correlate field data shifts with specific interventions.
Top Core Web Vitals tools for comprehensive monitoring
Choosing the right Core Web Vitals tools turns performance optimization from guesswork into a structured process. From Google’s free tools to advanced monitoring platforms, each option plays a specific role in building an effective performance strategy.
Google’s native ecosystem (The gold standard)
Google provides several interconnected tools forming the foundation of any Core Web Vitals monitoring strategy. These tools share common measurement methodologies and directly reflect how Google evaluates your site for ranking purposes.
- PageSpeed Insights: This service combines lab and field data into a single diagnostic interface. Enter any URL and within seconds you’ll see both Lighthouse-powered lab results and CrUX field data when available. The tool highlights specific opportunities for improvement ranked by potential impact, making prioritization straightforward. PSI is the most accessible tool for a quick snapshot of a single URL’s performance.
- Google Search Console: Offers the most comprehensive field data through its dedicated Core Web Vitals report. This interface groups URLs by performance status using CrUX data, helping you identify patterns across templates and page types. The report shows trends over time and sends email alerts when issues affect significant portions of your site. Search Console is your command center for tracking site-wide health and measuring optimization impact across your entire domain.
- Lighthouse and Chrome DevTools: These provide real-time auditing during development. Developers use these to test changes before deployment, catching performance regressions early in the development cycle. DevTools particularly shines for debugging, offering network waterfalls, JavaScript profiling, and the Layout Shift Region Flash tool visualize CLS. These represent your primary SEO tools Core Web Vitals options for technical diagnosis and validation.

Google’s native tools are the foundation of Core Web Vitals monitoring
Advanced third-party monitoring tools
While Google’s tools cover essential functionality, third-party platforms add capabilities around automation, historical tracking, and advanced analysis. These tools to measure Core Web Vitals fill gaps in Google’s ecosystem, particularly around continuous monitoring and competitive benchmarking.
- GTmetrix and WebPageTest: Deliver incredibly detailed performance breakdowns including waterfall charts showing exactly how your page loads. WebPageTest particularly excels with its filmstrip view showing visual progression and connection-level metrics like TTFB and DNS lookup times. These tools help answer the “why” questions that Google’s tools identify but don’t always explain fully. Their ability to test from multiple global locations and custom connection speeds helps optimize for international audiences.
- DebugBear: Specializes in automated monitoring with scheduled audits and performance alerting. The platform tracks changes over time, helping you correlate performance shifts with deployments or traffic pattern changes. DebugBear’s continuous monitoring catches performance degradation before it affects real users, making it valuable for teams pushing frequent updates. The service also monitors competitors, providing context for whether your performance issues reflect industry-wide problems or site-specific challenges.

Third-party tools enhance Core Web Vitals monitoring and automation
The best Core Web Vitals test tool strategy combines Google’s authoritative data with third-party platforms offering specialized capabilities. Use Search Console for authoritative field data, PageSpeed Insights for quick diagnostics, and specialized tools to measure Core Web Vitals like WebPageTest or DebugBear for deeper investigation and ongoing monitoring.
Step-by-step guide: How to check and analyze Core Web Vitals
Knowing which Core Web Vitals checker tools to use matters less than knowing how to turn their data into actionable insights. A structured approach helps you prioritize optimizations that deliver the biggest SEO and user experience gains.
Auditing at scale with Google Search Console
Start your analysis in Search Console’s Core Web Vitals report, which provides the only way to understand performance across your entire site. Navigate to Experience > Core Web Vitals and examine the report showing mobile and desktop performance separately. Google groups URLs by performance status, with separate views for “Poor,” “Needs Improvement,” and “Good” pages.
Click into the “Poor URLs” section first, as these pages negatively impact your Page Experience signals and urgently need attention. Search Console groups affected URLs into “Groups” based on similar structure, helping you identify systematic problems rather than fixing pages individually. For example, if all product pages show poor LCP, you’ve likely got an issue with product image optimization or template structure affecting hundreds or thousands of pages simultaneously.
Start Core Web Vitals analysis with Search Console’s site-wide report
Use the “Why URLs aren’t considered good” detail to understand which specific metrics fail. A page might show poor overall performance because of LCP alone, or it could fail all three metrics. This distinction dramatically affects your fix strategy. Export the URL lists to cross-reference with analytics data, prioritizing optimization for your most important landing pages first.. Your how to check Core Web Vitals process should always start with this site-wide view before drilling into individual page diagnostics.
Identifying root causes in PageSpeed Insights
Once you’ve identified problematic URL patterns, use PageSpeed Insights to diagnose specific causes. Enter a representative URL from each problematic group and examine both the field data and lab data sections. The field data confirms issues affect real users, while lab data helps identify technical causes via the Lighthouse audit.
PageSpeed Insights organizes findings into two main areas:
- Opportunities: These show specific improvements with estimated time savings, such as “Reduce unused JavaScript (save 3.2s)” or “Properly size images (save 1.8s).” These recommendations include expandable details showing exactly which resources cause issues and often provide code examples.
- Diagnostics: These provide additional information about page construction without specific time-save estimates. This section includes useful metrics like main-thread work breakdown, total page size, and JavaScript execution time.
Use PageSpeed Insights to diagnose specific Core Web Vitals issues
Together, these sections paint a complete picture of what’s slowing down your site. Document findings across multiple pages to confirm patterns before implementing template-level changes.
Simulating real-world conditions
Most developers test on powerful computers with fast internet connections, creating a fundamental disconnect from real user experiences. Testing under conditions matching your actual audience reveals problems invisible in ideal environments. Chrome DevTools includes throttling options that simulate slower devices and network speeds.
Open DevTools (F12), navigate to the Lighthouse tab (or Performance tab for deep analysis), and configure throttling to simulate a mid-tier mobile device on a 4G connection. By default, Lighthouse already uses “Simulated Throttling,” but manual throttling in the Performance tab provides a more granular look at how Interaction to Next Paint (INP) behaves under stress.
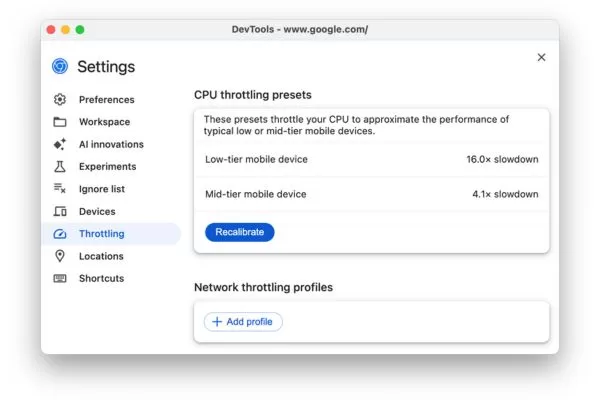
Test Core Web Vitals under real user device and network conditions
Consider your specific audience when configuring test conditions. If analytics show 70% of your traffic comes from mobile devices in emerging markets, test accordingly with more aggressive throttling. WebPageTest offers extensive location and device simulation options, letting you test from specific countries using various connection types. This targeted Core Web Vitals check approach ensures optimizations address actual user pain points rather than theoretical performance concerns.
Practical strategies to improve your Core Web Vitals scores
Understanding metrics and using the best SEO tools to check Core Web Vitals means little without knowing how to fix the issues they uncover. These proven optimization strategies target the most common causes of poor Core Web Vitals performance and help turn failing metrics into ranking-ready results.
Optimizing for LCP
Slow Largest Contentful Paint typically stems from one of four root causes: slow server response times, render-blocking resources, slow resource load times, or client-side rendering delays. Addressing these systematically improves loading performance measurably.
- Improve server response time (TTFB): Upgrade hosting if you’re on shared servers struggling under load. Implement server-side caching and use a Content Delivery Network (CDN) to serve content from edge locations closer to users.
- Optimize images and critical resources: Convert images to modern formats like WebP or AVIF. Crucially, disable lazy loading for any image likely to be the LCP element (like hero images), as lazy loading can actually delay the paint. Instead, use fetchpriority=”high” on your hero image and loading=”eager” to tell browsers to prioritize this critical resource.
- Eliminate render-blocking resources: Preload critical assets such as fonts and hero images. Inlining critical CSS directly in the HTML <head> while deferring non-essential CSS ensures browsers render your LCP element as quickly as possible.
Improve LCP by speeding up servers and prioritizing key images
Improving INP responsiveness
Interaction to Next Paint problems almost always trace back to JavaScript execution blocking the main thread. Browsers can only respond to user input when the main thread isn’t busy processing JavaScript, so optimizing script execution directly improves responsiveness scores.
- Reduce JavaScript execution time: Use tree-shaking to remove unused code and code splitting to deliver only what is needed. Audit third-party scripts (analytics, chat widgets, ads) as these are often the primary culprits for main-thread blocking.
- Break up Long Tasks: Any task running longer than 50ms blocks user input. Use the scheduler.yield() API (or a setTimeout fallback) to break up long-running scripts, allowing the browser to process user interactions between execution chunks.
- Use Web Workers: Move complex, non-UI processing off the main thread. For animations, stick to CSS transforms and opacity, which run on the compositor thread and don’t interfere with interaction responsiveness.
Breaking up long tasks improves responsiveness by freeing the main thread
Preventing layout shifts (CLS)
Cumulative Layout Shift issues come from page elements that lack reserved space before loading or from content that injects dynamically without proper positioning. Preventing shifts requires disciplined implementation of dimension attributes and careful management of dynamic content.
- Set explicit dimensions: Always include width and height attributes on images, videos, and iframes. For modern responsive design, use the CSS aspect-ratio property to reserve space across all screen sizes before the asset loads.
- Manage web fonts: Prevent Flash of Unstyled Text (FOUT) by using font-display: swap combined with CSS size-adjust (within @font-face) to match the dimensions of your fallback font to your custom font.
- Reserved space for dynamic content: Avoid injecting content (like ads or banners) above existing content. Use min-height on containers for dynamic elements so that when the content (like an ad) eventually loads, it doesn’t push the rest of the page down. Ensure that any UI changes triggered by a user interaction (like opening a menu) occur within 500ms, as shifts following user input are generally excluded from the CLS score.
Prevent CLS by reserving space for images, fonts, and dynamic content
Frequently asked questions (FAQs)
Here are concise answers to the most common questions about Core Web Vitals, helping you focus on what truly impacts rankings and real user experience.
Do I need a 100/100 PageSpeed score to rank #1?
You don’t need a perfect PageSpeed score to rank well. Google focuses on whether your Core Web Vitals meet the “Good” thresholds. Once you pass these thresholds, further improving your lab score (like moving from 95 to 100) provides diminishing returns for SEO rankings. Real user data (Field Data) matters more than lab scores, while content relevance and authority remain the primary factors for ranking.
Why does my lab data pass while field data fails?
The difference between lab and field data comes from controlled testing versus real user conditions. Lab tests use standardized hardware and stable connections, while field data reflects the 75th percentile of real users on diverse devices, unstable mobile networks, and older hardware. Additionally, field data is a 28-day rolling average, so it may still reflect old performance issues that you have already fixed in your lab environment.

Lab data passes while field data fails due to real user conditions and reporting delay
How often should I audit my Core Web Vitals?
Audit frequency should align with your site’s update pace. Check Google Search Console monthly for stable sites, weekly for frequently updated ones, and always before and after major releases. Implementing automated monitoring with alerts is recommended to catch performance regressions early and prevent long-term visibility drops.
Conclusion: Building a sustainable performance monitoring strategy
Core Web Vitals optimization is an ongoing process, not a one-time task. Successful websites build performance monitoring into daily workflows, using Core Web Vitals tools to set baselines, track key pages, and prevent regressions through automated testing and alerts before issues affect users or rankings. A truly sustainable strategy balances immediate feedback from lab data with the long-term trends provided by real user field data.
At the same time, Core Web Vitals are only one part of long-term SEO success. Strong content, authoritative backlinks, and optimized conversion paths remain just as important, with the most competitive sites balancing technical performance and overall digital strategy.
Want to elevate user experience and accelerate your revenue growth? Don’t let technical barriers slow your business down. Contact On Digitals today for expert SEO consulting, or explore our blog for the latest practical insights in Digital Marketing.
Visit On Digitals today!
Related content
Read more